
Your Ultimate Guide to Agile Story Point Estimation
When an Agile team talks about "estimation," they're not pulling out a crystal ball to predict exact hours or days. Instead, they're using story points to get a handle on the relative effort required to get something done.
Think of it this way: the goal isn't to guess how long a task will take a specific person. It's about figuring out how big one task is compared to another. This simple shift in perspective is what makes story point estimation so effective.
What Are Story Points and Why Do Teams Use Them
Let's say you're moving house with a friend. You’ve got two boxes left to pack. One is a small box, but it’s crammed with heavy books. The other is a huge box filled with light, fluffy pillows. If you both tried to guess the exact time it would take to pack each, you’d probably get different answers. Who's faster? Who's stronger?
But you could both instantly agree that the box of books is more effort to deal with than the box of pillows. That’s the core idea behind story points. It moves the conversation away from rigid, often wrong, time-based deadlines and toward a shared understanding of relative effort.
Moving Beyond Hours and Days
For years, development teams tried to estimate their work in hours. On the surface, it makes sense, but in practice, it’s a recipe for frustration. Why? Because an hour for a senior developer is completely different from an hour for a junior developer.
A senior might knock out a task in four hours, while a junior tackling the same job could easily spend a full day on it. This difference inevitably leads to arguments and makes it nearly impossible to land on a single time estimate the team can agree on. Using story points helps teams sidestep this entire problem.
"A Story Point is a relative unit of measure, decided upon and used by individual Scrum teams, to provide relative estimates of effort for completing requirements."
By abstracting the work into points, both the senior and junior developer can agree that a task is, say, a "5-pointer." They don't have to get bogged down in how many hours it will take them personally. The focus shifts from individual speed to a collective agreement on the task's size.
You can get a more detailed breakdown in our guide on what are story points in Scrum.
The Three Pillars of Story Point Estimation
So, what exactly goes into this idea of "effort"? It’s really a combination of three key ingredients that determine how challenging a piece of work will be.
- Complexity: How hard is this to wrap your head around? Are we dealing with tricky logic, or will we have to learn a brand-new technology to get it done?
- Uncertainty: How much do we not know? Are the requirements a bit fuzzy? Are we waiting on another team for something that could cause delays?
- Volume of Work: This one's simple—how much is there to do? It’s the sheer amount of stuff involved, from writing code to running tests and updating documentation.
These three elements work together to give a complete picture. A task might not seem like a lot of work on the surface (low volume), but if it's incredibly complex and full of unknowns, it will still get a high point value.
This is why agile story point estimation helps teams create more realistic plans. It builds a shared understanding that becomes the bedrock for predictable, and frankly, less stressful sprints.
Exploring Popular Estimation Techniques
So, your team understands what story points are. The next big question is, how do you actually come up with them? Agile teams don't just pull numbers out of thin air. They use structured, collaborative methods to land on a shared understanding of effort.
These techniques are all about sparking conversation, surfacing hidden assumptions, and stopping common biases from derailing your planning before it even starts. The best method often comes down to your team's experience and how much detail you need. Some are great for quick, high-level backlog grooming, while others give you the finer detail needed for sprint planning.
Let's dive into the most popular and effective approaches teams use every day.
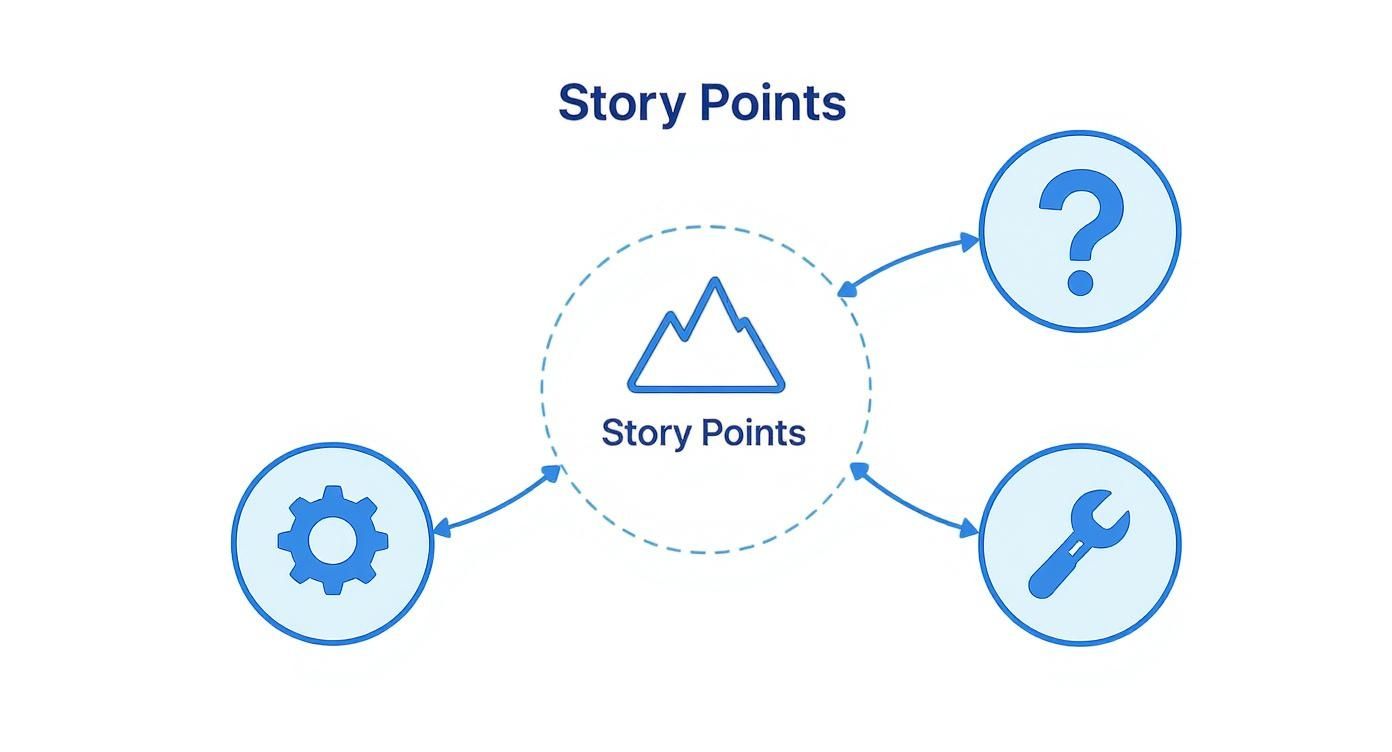
As you can see, a story point is really a mix of complexity, uncertainty, and the sheer amount of work involved. It’s not just one thing—it's a blend of all three.
Planning Poker: Getting Everyone on the Same Page
Planning Poker is probably the most widely used agile story point estimation technique, and for good reason. It turns what could be a dry meeting into a collaborative, almost game-like activity that gets everyone involved. The process is simple but incredibly powerful.
Here’s a quick rundown of how it works:
- The Story: The Product Owner presents a user story, explaining what needs to be done and why.
- Q&A: The team asks clarifying questions to make sure everyone is on the same page about the scope.
- The Vote: Each person privately chooses a card (or a digital equivalent) that represents their story point estimate. This private selection is key—it prevents anchoring bias, where the first number spoken out loud sways everyone else's opinion.
- The Reveal: On the count of three, everyone shows their card at the same time.
- The Discussion: If the estimates are close, great! You can quickly agree on a final number. But if there’s a big gap (say, a 2 and an 8), the real magic happens. The people with the highest and lowest estimates explain their thinking. This conversation is often more valuable than the number itself because it uncovers different perspectives and hidden complexities.
- Repeat: The team votes again, continuing the process until they reach a consensus.
This structured dialogue ensures estimates are built on a collective understanding, not just the opinion of the loudest person in the room. There are many other agile estimation techniques you can explore to complement your planning sessions.
Why the Fibonacci Sequence Is So Powerful
You might notice that most Planning Poker decks don't just use any numbers. They use a modified Fibonacci sequence: 1, 2, 3, 5, 8, 13, 21.... This isn't just a quirky choice; it’s a brilliant psychological tool. The ever-widening gaps between the numbers perfectly reflect the growing uncertainty that comes with bigger tasks.
Think about it: the difference between a 1 and a 2 is small and easy for our brains to process. But the difference between a 20 and a 21? It’s almost meaningless. The Fibonacci scale forces a more deliberate choice when estimating larger, more complex work.
Is that big task really an 8, or is it closer to a 13? The wide gap forces a more thoughtful conversation. Anything estimated above an 8 or 13 is often a clear signal that the story is too big and needs to be broken down into smaller, more manageable pieces.
T-Shirt Sizing for a Quick First Pass
Sometimes, you just don't need the precision of the Fibonacci scale, especially early on. When you're grooming the backlog for the first time or doing some long-term roadmap planning, the goal is to get a rough sense of size, not a specific number. That’s where T-shirt sizing shines.
This method uses simple, familiar sizes to group work items:
- XS (Extra Small)
- S (Small)
- M (Medium)
- L (Large)
- XL (Extra Large)
Teams can quickly sort a huge list of backlog items into these buckets without getting stuck in the weeds. It’s perfect for a first pass on a big epic or a new batch of features. Later, when those items are closer to being worked on, the team can circle back and assign more precise story points using Planning Poker.
Comparing Agile Estimation Techniques
Choosing the right technique depends on your context. Are you doing high-level planning or detailed sprint prep? Here’s a quick comparison to help you decide.
| Technique | Best For | Granularity | Primary Advantage |
|---|---|---|---|
| Planning Poker | Sprint Planning, Backlog Refinement | High (Numeric) | Fosters deep discussion and consensus. |
| Fibonacci Scale | Used with Planning Poker | High (Scaled Numeric) | Accounts for the growing uncertainty of larger tasks. |
| T-shirt Sizing | Initial Backlog Grooming, Roadmap Planning | Low (Relative Categories) | Fast, efficient, and great for quick sorting. |
Ultimately, there's no single "best" method. Many mature teams use a combination—T-shirt sizing for early-stage ideas and Planning Poker for items heading into an upcoming sprint. This tiered approach keeps the estimation process both efficient and effective.
How to Calibrate Your Team for Consistent Estimates
For story points to actually work, everyone on your team needs to be on the same page. A "5-pointer" should feel roughly the same to your most seasoned architect as it does to your newest developer. This shared understanding doesn't just magically appear—you have to build it through a process called team calibration.
Calibration is what turns story point estimation from a bunch of subjective guesses into a reliable, shared system. Without it, your team's velocity will be all over the place, and sprint planning will feel more like guesswork than a strategic meeting. The goal here is to create a common scale of effort that everyone understands and can reference.
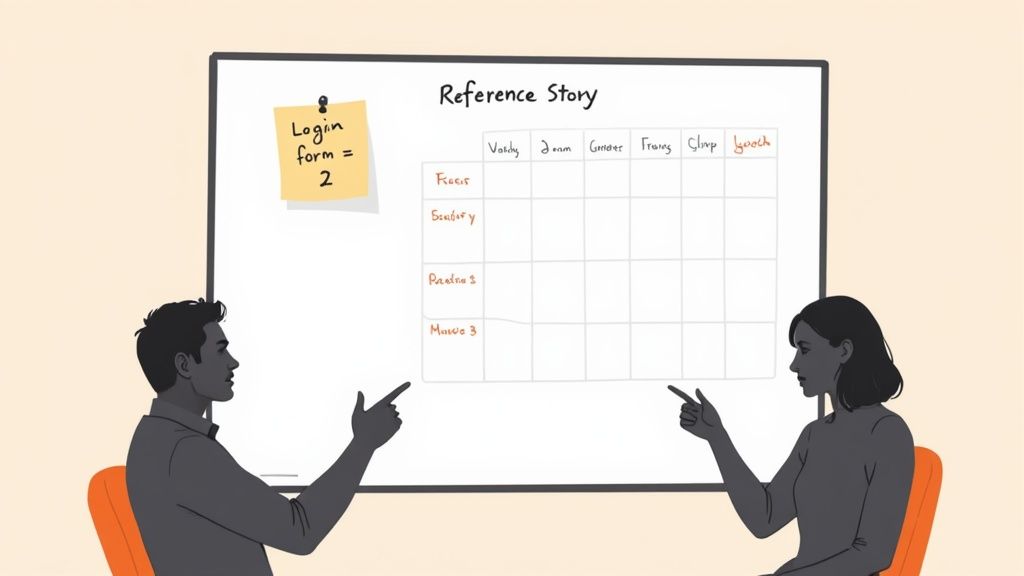
This whole process anchors your estimation practice. By creating clear, tangible examples for different point values, you're giving the team a solid foundation for sizing up all future work.
Find Your Anchor: The Reference Story
The very first step is to set an anchor. This is your reference story—a small, well-understood piece of work that everyone on the team can agree on. The key is to pick a task that has minimal complexity and almost zero uncertainty.
Think of it like setting the "one-inch" mark on a new ruler. Once that’s locked in, all other measurements make sense. A classic example of a good reference story is a simple user login form. It’s a solved problem for most teams.
Your ideal reference story is something the team has either built before or understands inside and out. It should be so straightforward that there are no hidden surprises, making it the perfect baseline to measure everything else against.
Once you have a candidate for your reference story, the team talks it over and collectively gives it a low point value from your scale, usually a 2 or a 3. That number now becomes your team's fundamental unit of measurement.
Build Your Estimation Matrix
With your anchor story firmly in place, it's time to build out the rest of your scale. The best way to do this is by running a calibration workshop. Just grab a handful of user stories from your backlog that represent a good mix of sizes and complexities.
The process itself is simple but incredibly effective:
- Present the First Story: The facilitator kicks things off by presenting the next user story from the pre-selected list.
- Compare and Contrast: Now the team discusses this new story relative to the reference story. Is it about the same size? Is it twice as big? Is there way more complexity involved?
- Estimate Collaboratively: Using Planning Poker, everyone votes on the story. The real magic happens in the discussion that follows the vote, as this is where alignment is built.
- Document the Result: Once the team reaches a consensus, write down the story and its point value. This story now becomes another benchmark for future reference.
Keep repeating this process with a few other stories of different sizes. Your goal is to create an estimation matrix—basically, a set of benchmark stories that clearly define what each point value means to your team.
For instance, you might end up with a reference board that looks something like this:
- 2 Points: User login form (minimal complexity, everyone gets it)
- 5 Points: "Forgot password" flow (more steps, some email integration complexity)
- 8 Points: User profile page with image upload (multiple components, a third-party service, and a bit more uncertainty)
This documented set of examples becomes a living, breathing tool. New team members can look at it to get up to speed quickly, and the existing team can refer back to it to keep their estimates consistent. After all, consistent estimates are the key to calculating a reliable team velocity, which is crucial for forecasting. To dive deeper, you can check out our guide on what is velocity in Scrum and see how it impacts your planning.
By investing just a little bit of time in calibration, you create a robust system that fosters better communication and leads to far more predictable sprints.
How to Dodge the Common Biases That Wreck Your Estimates
Even the sharpest teams can see their story point estimates go sideways thanks to a few tricky cognitive biases. These are basically mental shortcuts our brains take, and while they're often unconscious, they can seriously warp our judgment and lead to some pretty unreliable sprint plans. The first step to a more objective and accurate estimation process is simply knowing what these traps look like.
Let's face it, we're all human. We fall into certain patterns of thinking that don't always help us in a planning session. If you let them run wild, these biases can turn a great collaborative exercise into a source of frustration, packed with overcommitments and busted sprint goals. The good news? With a little awareness and the right techniques, you can keep them in check.
The Dangers of the First Number Spoken
One of the sneakiest and most common biases is Anchoring. This happens the moment someone throws out the first number. That number, whether it's well-thought-out or not, becomes the anchor that pulls every other estimate toward it.
Imagine a senior developer casually says, "Oh, this looks like a 3." Boom. The anchor is set. Suddenly, other team members who might have been thinking it was a 5 or an 8 start second-guessing themselves. They subconsciously nudge their own estimates down to be closer to that first number, even if their gut is screaming that the task is way more complex. This is how a team ends up consistently underestimating work—all because one person spoke first. It’s also exactly why Planning Poker is so powerful; the simultaneous reveal means there's no anchor to begin with.
The Problem with "Happy Path" Thinking and Staying Quiet
Two other troublemakers you'll run into are Optimism Bias and Groupthink. Optimism Bias is that classic human tendency to think things will probably go better for us than they actually will. In sprint planning, this looks like underestimating how complex a task is and assuming the "happy path" where nothing goes wrong. We conveniently forget about surprise bugs, confusing requirements, or that meeting that will inevitably pop up and steal an afternoon.
Then you have Groupthink. This is the pressure to conform and maintain harmony, and it can be deadly for good decision-making. A developer might completely disagree with an estimate but stay quiet just to avoid conflict or not be "that person." This silence is a huge red flag because it kills the exact conversations that expose hidden risks and lead to better, more realistic estimates.
A facilitator's main job here is to create a space where it feels safe to disagree. Healthy debate isn't a problem; it's a sign of a team that's engaged, thinking hard, and cares about getting it right.
Practical Ways to Keep Biases Out of Your Estimates
Fighting these biases isn’t about just "trying harder." It takes deliberate, structured effort. You have to build safeguards right into your estimation process. This is where a good facilitator, usually the Scrum Master, becomes invaluable by guiding the team and making sure everyone sticks to the plan.
Here are a few simple strategies your team can start using right away:
- Vote at the Same Time: Use a tool like Planning Poker where everyone shows their cards (or clicks their button) at once. This is hands-down the most effective way to kill anchoring bias before it even starts.
- Talk About the Outliers: When the votes are all over the place—say, you get a 2 and an 8 for the same story—make it a rule that the folks with the highest and lowest numbers have to explain their thinking. This turns a disagreement into a fantastic learning moment for the whole team.
- Lean on Your Reference Stories: Always bring the conversation back to your established estimation matrix or reference stories. Ask the team, "Is this new story really more complex than our 5-point reference story?" This grounds the discussion in a shared reality, not just gut feelings.
- Use a Timer: To keep discussions from dragging on forever, set a timer. This forces the team to stay focused on getting to a "good enough" consensus and moving on, which helps avoid analysis paralysis.
By actively working to sidestep these biases, you can transform your agile story point estimation from a frustrating guessing game into a genuinely useful tool for creating a shared understanding and building plans you can actually hit.
Using Data to Improve Your Estimation Accuracy
Great agile story point estimation isn't a one-and-done deal. It's a skill, and like any skill, it sharpens over time with consistent practice and feedback. Your first few estimates are really just educated guesses, but as your team ships work sprint after sprint, you start building a goldmine of historical data. This data is the key to shifting your planning from speculative to predictive, helping you fine-tune your accuracy and build real trust with stakeholders.
The idea is to create a simple feedback loop: you estimate, you do the work, and then you review what actually happened. This cycle helps your team find its natural rhythm, truly understand its capacity, and make smarter, more realistic commitments down the road.

Calculating Your Team Velocity
The most fundamental metric you’ll use is team velocity. Think of it as your team's proven capacity—it’s simply the average number of story points your team actually completes in a sprint. It’s a powerful, backward-looking measure that tells you what you're capable of.
Calculating it is straightforward. Just add up the points for all the user stories that are 100% done at the end of a sprint. Once you have this number for a few sprints (a good rule of thumb is 3-5), you find the average.
For example, if your team completed 25, 30, and 28 story points over the last three sprints, your average velocity is 27.6. Now, you can plan your next sprint with confidence, knowing that taking on about 28 points is a realistic goal.
It’s critical to remember that velocity isn't a performance metric for judging or comparing teams. It’s a forecasting tool, pure and simple. It answers the crucial question, "Based on what we've done before, what can we realistically get done next?"
Using the Say/Do Ratio as a Health Check
While velocity tells you what you can do, the Say/Do Ratio tells you how reliable your planning is. This metric compares the story points a team commits to at the beginning of a sprint (the "say") with what they actually deliver by the end (the "do"). A ratio hovering around 100% is a great sign that your planning and capacity are in sync.
Let's look at an example:
- Say: 30 Story Points Committed
- Do: 27 Story Points Delivered
- Say/Do Ratio: 27 / 30 = 90%
If you notice this ratio is consistently low, don't treat it as a failure. Treat it as a signal. It’s an invitation to dig deeper during your next retrospective. Is the team being a bit too optimistic during planning? Are stories not well-defined? Are unexpected interruptions constantly throwing a wrench in the works?
Fueling Retrospectives with Data
Metrics like velocity and the Say/Do Ratio are only useful if they spark meaningful conversations. They aren't meant to be used as a stick to beat the team with; they are tools for self-improvement.
Bring this data into your sprint retrospectives and use it to ask better questions:
- Why was our velocity lower than average this sprint?
- What created the gap between what we said we'd do and what we actually did?
- Did any stories end up being way bigger or smaller than we estimated? What did we learn from that?
These discussions help the team spot patterns and come up with concrete, actionable improvements. Maybe you realize you need to spend more time refining the backlog, or perhaps you need to start accounting for those recurring support tasks that always seem to eat into your sprint time. This data-driven approach moves your retros from being based on feelings to being grounded in facts.
The real-world impact is significant, especially for distributed software teams. One company, by implementing standardized estimation practices like reference stories and data collection, saw a 47% reduction in estimation variance within six months. This led directly to a 38% improvement in sprint predictability and a 42% increase in their on-time delivery rate. It just goes to show how a harmonized, data-backed process can make a massive difference. You can read more about how estimation methodologies help distributed Agile teams on FullScale.io.
Connecting Story Points to Business Goals
Let’s be honest: story points can feel a bit fuzzy to the people paying the bills. Stakeholders work in deadlines and budgets, so talking about abstract effort units can feel disconnected from their reality. But this is where great agile teams shine. They master the art of translating these relative points into something the business can count on: predictable outcomes.
The secret ingredient here is a stable team velocity. While story points are intentionally not tied to hours, a consistent velocity acts as a reliable stand-in for your team's capacity. It’s what turns a backlog full of abstract numbers into a powerful forecasting tool.
From Points to Predictability
Imagine your team consistently knocks out about 30 story points every sprint. Suddenly, you have a solid baseline. A product owner can now look at a 150-point backlog and confidently project that it’ll take roughly five sprints to get through. No, it’s not a guarantee carved in stone, but it’s a data-driven forecast that beats old-school guesswork every time.
This kind of predictability is gold for stakeholders. It finally gives them clear answers to their most important questions:
- "When can we expect this feature?" Instead of a vague "it's coming," you can point to the backlog and your team's velocity to offer a realistic release window.
- "What can we get by the end of the quarter?" Now you can work backward from a hard deadline, using velocity to show which features are likely to make the cut.
Building Trust with Stakeholders
How you communicate this is everything. You need to help stakeholders understand that while a "5-point story" doesn't mean a specific number of hours, the team's average point output over time is an incredibly dependable measure of progress. This moves the conversation away from micromanaging hours and toward what really matters: delivering value.
A stable velocity is the currency of trust between a development team and the business. It proves that estimation isn't just an internal game but a direct enabler of strategic planning and transparent communication.
Historically, this is exactly why story points were created back in the early 2000s—to fix the endless problems of time-based estimates. Industry reports consistently show that when teams use story points to track their commitments, their release planning accuracy goes way up. A team's velocity—the sum of points completed per sprint—quickly became the go-to metric for forecasting. You can dig deeper into how story points improve estimation on AgileAlliance.org.
In the end, a solid agile story point estimation process does more than just help developers plan their work. It aligns the team's real-world capacity with the big-picture business goals, turning abstract effort into tangible, predictable value.
Got Questions About Story Points? We've Got Answers
Even when you feel like you've got the hang of story points, some questions seem to pop up again and again, especially for teams just starting out. Let's tackle a few of the most common ones that can trip people up.
Think of this as the practical advice section—the stuff that helps you stay on track and avoid slipping back into old, time-based habits.
Can You Convert Story Points to Hours?
This is probably the most common question, and the answer is a firm no. It's tempting, I get it, but converting story points into hours completely undermines why we use them in the first place.
Story points are about relative effort—a blend of complexity, risk, and the sheer amount of work. They aren't about time on a clock. A senior developer might knock out a 3-point story in four hours, while a junior dev needs six. The effort involved, from the team's perspective, is still a 3.
Tying points to hours just brings you right back to the problem story points were designed to solve: focusing on an individual's speed instead of the team's collective capability. A much better way to forecast is to use your team's velocity—the average number of points you finish per sprint—to see how much you can get done over time.
This keeps the conversation focused on what the team can deliver together, which is what really matters.
What Should We Do When We Can’t Agree on an Estimate?
First off, don't panic. Disagreement is actually a good thing! When you're running a Planning Poker session and someone throws down a 2 while another person votes an 8, that's not a failure. It's a signal.
It means people are seeing the task in fundamentally different ways, and you've just uncovered a critical knowledge gap. This is your chance to get everyone on the same page.
When this happens, have the people with the highest and lowest estimates explain their thinking. This simple conversation almost always reveals things like:
- Hidden complexities one person saw but others missed.
- Unclear requirements that need clarification.
- Different assumptions about how the work will be done.
The whole point of estimating isn't just to get a number; it's to build a shared understanding of the work. After a quick chat, have everyone re-vote. You'll be surprised how quickly the estimates line up.
How Do You Estimate Bugs or Spikes?
This is another classic. For bugs, if the fix is straightforward and you know exactly what needs to be done, you can estimate it like any other user story.
But what about those mysterious bugs where you have no idea what's causing the problem? For those, you create a spike. A spike is a short, time-boxed investigation to figure out the solution. You estimate the effort for the spike itself (e.g., "This feels like a 2-point investigation"), not the eventual fix.
Once the spike is done, you'll have a much clearer picture. You can then write a proper user story for the fix and estimate that piece of work. This keeps the team from committing to a task with a totally unknown scope.
Ready to make your estimation sessions faster and a whole lot smoother? The Scrum Planning Poker tool is free, requires no signup, and can get your team aligned in minutes. Start your first session and see for yourself.