
what are story points in scrum: A quick guide
In the world of Scrum, story points are a simple yet powerful way to gauge the total effort needed to get a user story done. Instead of getting bogged down in guessing how many hours a task might take, teams assign points. These points consider everything—the complexity, any potential risks, and the sheer volume of work involved.
This clever approach shifts the team's focus from the time it takes one person to do something to the overall size of the work itself.
An Introduction to Agile Estimation: What Are Story Points?

If you’ve ever been asked for a "quick" estimate in hours, you know how that story ends. Time-based estimates often create a false sense of accuracy and set teams up for failure. An hour for a senior engineer is a world away from an hour for a junior developer, which makes planning stressful and wildly inaccurate.
Story points were created to fix this exact problem. They reframe the conversation entirely. You stop asking, "How long will this take?" and start asking, "How big is this compared to other things we've done?" This simple but profound shift moves the focus from individual speed to a shared team understanding of the work.
Why Sizing Things Relatively Just Works Better
Imagine you're moving houses. You have three boxes in front of you: a small one for books, a medium one for kitchen supplies, and a massive wardrobe box. Instead of guessing how many minutes it will take to fill each one, you can instinctively say the kitchen box is about twice the effort of the book box, and the wardrobe box is maybe five times the effort.
That’s the essence of story points. You’re not predicting the future; you're comparing one piece of work to another based on your collective experience. It’s a holistic measure that naturally accounts for all the work—coding, testing, collaborating, and documenting.
A Story Point is a relative unit of measure, decided upon and used by individual Scrum teams, to provide relative estimates of effort for completing requirements.
This focus on relative effort sparks much healthier discussions. When two developers disagree on a point value, it’s not an argument—it's a sign that they have different assumptions. One might see a hidden complexity the other missed. This conversation is invaluable, as it brings clarity and alignment before a single line of code is written.
The Rise of a Practical Idea
The concept of story points gained traction in the early 2000s, born out of the Extreme Programming (XP) community. XP co-founder Ron Jeffries championed the idea as a way to escape the rigid, and often broken, promises of time-based planning.
Interestingly, while story points are a staple in the agile world, they aren't officially mentioned in the Scrum Guide. Despite that, they've become a de facto industry standard. Today, industry surveys show that around 70-80% of agile teams use story points for estimation, making it one of the most widespread practices in software development. You can dive deeper into the history and impact of story points to see how they've shaped modern agile methods.
Ultimately, story points are a communication tool, not a contract written in stone. They are less about making perfect time-bound predictions and more about building team consensus, uncovering risks early, and establishing a sustainable pace. Grasping this is the key to more predictable, collaborative, and, frankly, less stressful planning.
To really see the difference, it helps to compare story points directly against the old way of doing things.
Story Points vs Time-Based Estimates at a Glance
This table breaks down the fundamental differences between estimating with relative story points and traditional absolute time (like hours or days).
| Attribute | Story Points (Relative Effort) | Time-Based Estimates (Absolute Time) |
|---|---|---|
| Unit of Measure | Abstract points representing a blend of complexity, risk, and volume. | Concrete units of time, such as hours or days. |
| Focus | How big is the work compared to other work? (Team-centric) | How long will the work take for an individual? (Person-centric) |
| Impact of Skill | The estimate is independent of who does the work. A '5' is a '5'. | The estimate is highly dependent on the skill of the person doing it. |
| Decay Over Time | Estimates remain valid as the team's shared understanding grows. | Estimates become obsolete as soon as the work is handed to someone else. |
| Purpose | To foster conversation and achieve a shared understanding of scope. | To create a schedule and make time-bound commitments. |
| Best For | Long-term forecasting, release planning, and measuring team velocity. | Short-term, highly predictable tasks with a single assignee. |
As you can see, story points are designed for team alignment and long-term planning, while time-based estimates are more suited for individual task management. For the collaborative and often unpredictable nature of software development, the relative approach offers far more flexibility and resilience.
What Goes Into a Story Point? The 3 Key Ingredients

Story points give teams a way to size up work that's much richer than a simple time estimate. Instead of just guessing "how many hours?", they force us to think about the total effort needed to get a task completely finished.
That effort is really a blend of three key ingredients. When you're estimating, you're not just looking at one aspect of the job; you're weighing all three together to land on a single point value. This is what makes the estimation conversation so valuable—it gets everyone talking about what it really takes to get a story to "done."
1. Work Complexity
First up is work complexity. This is all about how mentally challenging or intricate the task is. It's the "brain-power" ingredient.
Think about it like building furniture. Putting together a simple, flat-pack bookshelf from IKEA is pretty straightforward. You follow the instructions, you know what to expect, and there aren’t many surprises. That’s a low-complexity task, so it would get a low point value.
But what if you were asked to build a custom, curved, built-in library wall? That’s a whole different ballgame. It demands specialized knowledge, tricky calculations, and precision you can’t afford to get wrong. The sheer difficulty means it's a high-complexity job, earning it a much higher story point estimate, no matter how long it actually takes.
2. Risk and Uncertainty
Next, you have to consider risk and uncertainty. This is the "what could go wrong?" factor. It covers all the unknowns, dependencies, and potential curveballs that could derail an otherwise simple task.
Risk can pop up in a lot of places, but here are some common culprits:
- External Dependencies: Is the team waiting on another team or a flaky third-party API? That's a risk.
- Vague Requirements: If the acceptance criteria are fuzzy, the team will have to make guesses, which can lead to rework.
- New Technology: Using a brand-new programming language, framework, or library for the first time is always a bit of an adventure.
The more unknowns you have, the higher the risk. A bigger story point value acts as a buffer, acknowledging that the path forward isn’t perfectly clear and might involve a few detours.
A task with high uncertainty requires more discovery and problem-solving, which is a form of effort. Story points give teams a way to quantify that uncertainty and make it visible in their planning.
3. Volume of Work
The last ingredient is volume of work. This one is the most concrete: it’s simply the sheer amount of stuff that has to get done. It's not just about the code.
Volume includes every single step needed to call the story complete, like:
- Writing the actual code
- Creating and running unit tests
- Doing manual QA checks
- Updating documentation
- Coordinating with designers or other developers
A task that involves a tiny text change is low-volume. One that requires touching multiple parts of the codebase, changing a database schema, and writing a new user guide is high-volume.
When you combine complexity, risk, and volume, you get a well-rounded picture of the total effort, which is the secret to making more accurate and reliable estimates.
Choosing Your Scale: From Fibonacci to T-Shirts
Once your team gets the hang of what a story point actually represents, the next question is always, "So, how do we assign them?" Instead of just pulling numbers out of thin air, agile teams use established scales to bring some much-needed structure and consistency to the whole process. These scales aren't random; they’re designed to reflect a simple truth about estimation: the bigger and more complex something is, the fuzzier our guess gets.
The most popular and effective scale by far is the modified Fibonacci sequence. You’ve probably seen the cards: 0, 1, 2, 3, 5, 8, 13, 20, 40, 100. The magic here is that the gaps between the numbers get wider as they go up. That’s a feature, not a bug.
This widening scale is brilliant because it forces us to be honest about uncertainty. Arguing whether a task is a '2' or a '3' is a small, manageable discussion. But the massive jump from '13' to '20' makes the team pause and admit, "Wow, this thing is big and we don't fully understand it." It stops us from getting stuck on false precision and pushes the team to break down huge, vague stories into smaller, clearer pieces. For a deeper dive, check out our guide on the Fibonacci sequence in Planning Poker.
The Power of the Fibonacci Sequence
The Fibonacci scale just clicks with how our brains work. We're great at telling the difference between small things, but not so much when it comes to massive ones. Is a task a '20' or a '21'? Who cares? The debate is pointless because the estimate is already a huge guess. The scale makes us choose: is it a '13' or a '20'? That's a meaningful distinction that sparks a productive conversation.
Remember, story points blend effort, complexity, and risk into one number. The non-linear jumps in the Fibonacci sequence perfectly mirror how these factors pile up in larger user stories. This is why it’s a cornerstone of estimation techniques like Planning Poker, which brings the whole team into the conversation to get a well-rounded estimate.
Other Popular Estimation Scales
While Fibonacci is king, it's not the only game in town. Some teams prefer simpler scales, and each has its own pros and cons.
T-Shirt Sizes (XS, S, M, L, XL): This is a fantastic way to start, especially for teams new to agile. It feels intuitive and less intimidating than numbers, keeping the focus squarely on relative size. The only catch is you can't calculate velocity with T-shirts, so teams usually map them to Fibonacci numbers anyway (e.g., S=2, M=5, L=8).
Linear Sequence (1, 2, 3, 4, 5): It’s simple, sure, but it's not great for complex work. This scale suggests the jump from a '4' to a '5' is the same as from a '1' to a '2', which is rarely true in software development. It creates a false sense of accuracy on bigger tasks.
Doubling Sequence (1, 2, 4, 8, 16): This works a lot like Fibonacci, creating those crucial gaps to account for uncertainty. It’s a solid alternative, though some find the jumps a bit too dramatic.
This image shows a classic set of Planning Poker cards that use the modified Fibonacci sequence.
You can see how the numbers spread out, which is a great visual reminder that our confidence drops as the size of the task grows.
Establishing Your Baseline Story
No matter which scale you pick, you have to start by establishing a baseline story. This is a small, well-understood task that everyone on the team agrees on. Think of it as your yardstick for everything else.
Your baseline story is the anchor for your entire estimation process. The team might decide, for example, that "As a user, I want to change my password" is a solid '2'. From that moment on, every other story is sized up against it: "Is this new story smaller, bigger, or about the same as our '2'-point password story?"
This shared reference point is the secret to getting consistent and reliable estimates sprint after sprint. Without it, your points are just numbers floating in a void. By anchoring every estimate to a real, concrete example, you create a shared language of effort that makes your planning far more accurate and predictable.
How to Run Planning Poker Like a Pro
If you want to get good at estimating, you need a solid process. Planning Poker is a classic for a reason—it turns the often-dreaded task of estimation into a collaborative, engaging exercise. It’s less about landing on a perfect number and more about getting the whole team on the same page about what it really takes to get something done.
To make it work, everyone has a specific role to play.
The Product Owner is your storyteller. They kick things off by presenting each user story, explaining its purpose, and clarifying the requirements. They represent the customer's needs but—and this is important—they don’t get a vote in the estimation.
The Scrum Master is the referee and facilitator. Their job is to keep the session running smoothly, make sure the discussion stays on track, and guide the team toward a consensus without actually influencing their estimates.
Finally, the Development Team holds the cards. This includes everyone who will be doing the work—developers, QA engineers, designers, you name it. They are the ones asking the tough questions, digging into the details, and ultimately casting the votes based on their collective experience.
The Planning Poker Process Step-by-Step
A good Planning Poker session follows a predictable rhythm. It's designed to bring out different perspectives and prevent one or two loud voices from dominating the conversation.
- The Pitch: The Product Owner introduces a user story, explaining what it is and why it matters to the user.
- The Inquisition: Now it’s the Development Team's turn. They pepper the Product Owner with questions to iron out any ambiguities. This is where you hear things like, "Which browsers do we need to support for this?" or "Does this feature depend on that third-party API we've been having trouble with?"
- The Private Vote: With a clearer picture in mind, each team member privately chooses a card from their deck (typically using the Fibonacci sequence) that reflects their personal estimate of the story's effort. Keeping it private is key to avoiding "anchoring," where the first number thrown out sways everyone else's opinion.
- The Big Reveal: Everyone flips their cards over at the same time. This simple act gives an instant, powerful visual of where the team stands.
- The Discussion: If the numbers are all pretty close, great! The team can quickly lock in a number and move on. But if the votes are all over the place—say, a 3 and a 13 for the same story—that’s when the real work begins.
This process is really a continuous loop: you establish a baseline, estimate new work against it, and compare your findings to refine future estimates.
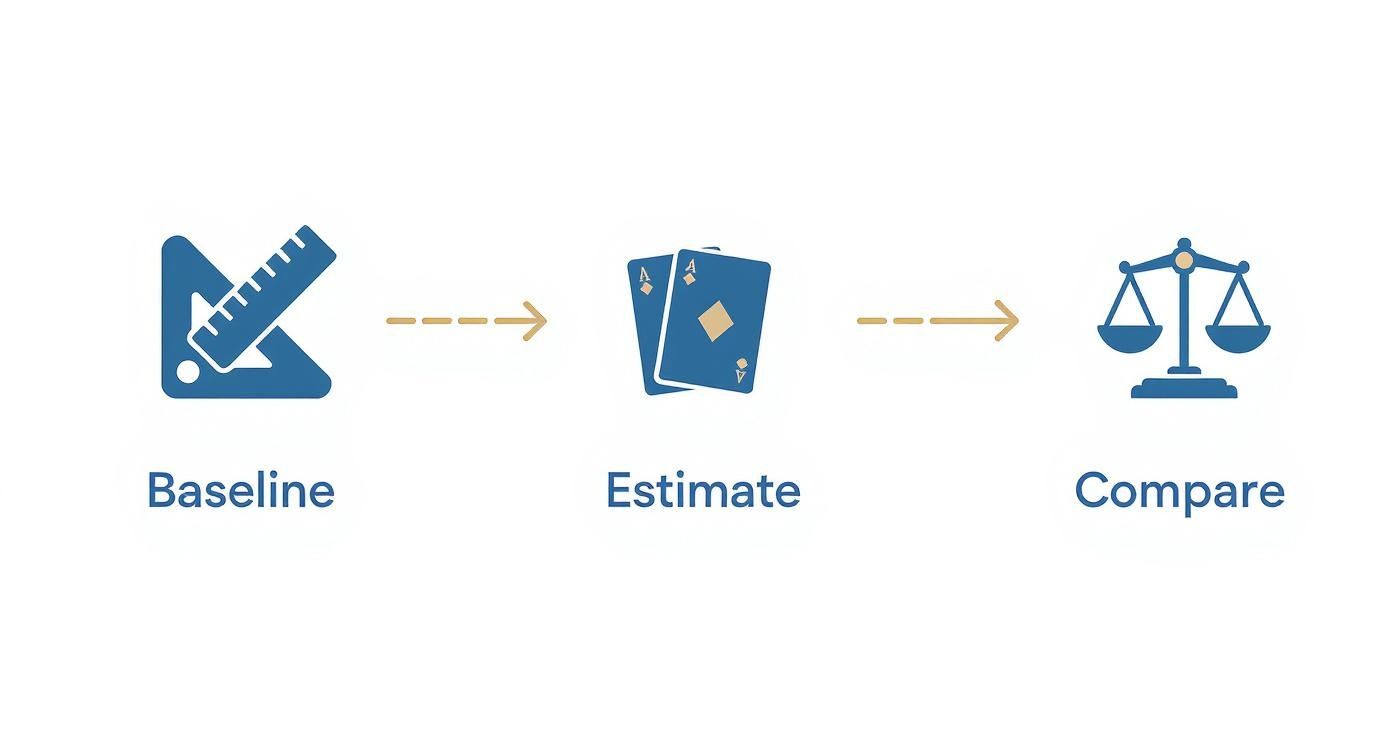
This cycle is the engine that drives consistent and reliable team estimation over time.
The Value of Divergent Estimates
It might seem counterintuitive, but the most valuable part of Planning Poker isn't when everyone agrees—it's when they don't. A wide spread in votes is a signal that the team is seeing the same problem from completely different angles.
The Scrum Master will typically ask the people who voted highest and lowest to share their reasoning. This isn't about one person being "right." It's about sharing crucial context.
The developer who voted 13 might say, "I've worked on this part of the codebase before, and it’s a mess. There are no tests, and every change we make seems to break something else."
Meanwhile, the person who voted 3 might respond, "Ah, I didn't realize this touched that legacy system. I thought we were building this with the new microservice."
In just a few sentences, a massive blind spot has been exposed for the entire team. This conversation uncovers hidden complexities, technical debt, and knowledge silos before they have a chance to derail a sprint. After the discussion, the team votes again, and they almost always land much closer together. For more hands-on tips, check out The Complete Guide to Planning Poker to help your team master the process.
Tips for Remote and Hybrid Teams
Planning Poker isn’t just for co-located teams anymore. With digital tools like Scrum Planning Poker, remote and hybrid teams can get the same benefits. These platforms let everyone vote privately and reveal their estimates simultaneously, just like they would with physical cards.
Whether you're in the same room or spread across the globe, here are a few tips to keep your sessions sharp:
- Timebox the Talk: Don't let discussions drag on forever. If a story is sparking an endless debate, it's probably too big or poorly defined. Take it offline, break it down, and bring it back later.
- Use a Timer: A simple two-minute timer for the post-vote discussion can work wonders for keeping things focused.
- Keep It Light: Remember, it's a game! A relaxed, fun atmosphere encourages honesty and makes people more comfortable sharing their real opinions.
- Don't Average the Votes: It’s tempting to just take the average of a split vote to save time, but don't do it. You'll miss out on the rich conversation where the real value of the exercise lies.
So, you’ve got these abstract points for each task. That’s great for team huddles, but how do you turn them into something you can actually build a plan around? This is where a simple but incredibly powerful metric comes into play: velocity.
Think of velocity as the amount of work a team typically gets done in one sprint, measured in story points. It's not about how fast people are working or who is the most "productive." It’s purely a measure of capacity.
Imagine you're loading boxes onto a truck. After a few trips, you figure out you can consistently fit about 20 boxes per trip. That's your velocity. Now you can look at the 200 boxes left in the warehouse and confidently say, "It'll take about 10 more trips."
Velocity is what connects those relative estimates to real-world forecasting. Tracking it allows teams to answer that all-important question, "When will we be done?" with a surprising degree of confidence.
Calculating Your Team Velocity
Figuring out your team's velocity is surprisingly simple. At the end of a sprint, just add up the story points for all the user stories that your team fully completed—meaning they met every single condition in your Definition of Done.
It’s best to wait until you have data from a few sprints, usually 3 to 5, before calculating an average. This helps smooth out the natural ups and downs that happen in any project, giving you a much more reliable number to plan with.
Here’s a quick example of what that looks like:
- Sprint 1: The team knocked out 22 story points.
- Sprint 2: A few roadblocks popped up, so they finished 18 story points.
- Sprint 3: Things clicked, and the team had a great run, completing 26 story points.
- Sprint 4: Another strong sprint, closing out with 24 points.
To get the average velocity, you'd add them up (22 + 18 + 26 + 24 = 90) and divide by the number of sprints (4). In this case, the team’s average velocity is 22.5 points per sprint. You can dive deeper into this topic in our detailed guide on what is velocity in scrum.
From Velocity to Forecasting
Once you have a stable velocity, forecasting becomes straightforward. Let's say your product backlog has a total of 225 story points left for the next big release. The math is simple:
Total Remaining Story Points / Average Velocity = Number of Sprints Remaining
Using our example: 225 / 22.5 = 10 sprints.
Suddenly, you've got a data-driven forecast to share with stakeholders. This isn't just a wild guess; it's based on the team's actual, demonstrated pace. This predictive power is why Scrum co-creator Jeff Sutherland has noted that high-performing teams find story points far more effective than estimating in hours. You can read more discussions on the power of story points for forecasting to see why so many teams move away from time-based estimates.
Let's put this into a table to see how it works over a project lifecycle.
Sample Velocity Calculation and Release Forecast
Here’s an example showing how a team calculates its average velocity over several sprints and uses it to forecast the completion of a 150-point project.
| Sprint Number | Completed Story Points | Calculation Notes |
|---|---|---|
| Sprint 1 | 20 | Initial velocity. Not enough data to forecast yet. |
| Sprint 2 | 18 | Average velocity is now (20+18)/2 = 19. Forecast: (150-38)/19 = 5.9 sprints. |
| Sprint 3 | 23 | Average velocity is (20+18+23)/3 = 20.3. Forecast: (150-61)/20.3 = 4.4 sprints. |
| Sprint 4 | 21 | Average velocity is (18+23+21)/3 = 20.7 (using last 3). Forecast: (150-82)/20.7 = 3.3 sprints. |
| Sprint 5 | 22 | Average velocity is (23+21+22)/3 = 22. Forecast: (150-104)/22 = 2.1 sprints. |
As you can see, the forecast becomes more stable and accurate as the team completes more sprints and their velocity stabilizes.
Crucial Rule: Velocity is a forecasting tool for the team. It should never be treated as a performance metric for managers to judge or compare teams.
This is a non-negotiable rule. Every team's story point scale is unique to them. A '5' for Team A means something completely different than a '5' for Team B. Comparing their velocities is like comparing 30 degrees Fahrenheit to 30 degrees Celsius—they use the same number but measure entirely different things. Using velocity as a weapon will only push teams to inflate their estimates, which completely destroys the trust and accuracy you’re trying to build.
Common Story Point Pitfalls and How to Sidestep Them
Adopting story points is one thing, but really mastering them is another beast entirely. Even seasoned teams can stumble into common traps that, over time, can strip all the value out of their estimation process. Think of this as your field guide to spotting and fixing the most frequent missteps, keeping your points meaningful and your planning sharp.
The biggest and most damaging mistake is trying to force a direct translation between story points and hours. It’s a shortcut that seems logical on the surface, but it completely defeats the purpose of relative estimation.
Mistake 1: Equating Story Points to Hours
It usually starts with an innocent question: "So, one story point is basically four hours, right?" The moment a team locks in a fixed conversion rate like this, they’ve stopped estimating effort and have just started estimating time with a different label. This immediately brings back all the problems story points were designed to solve, like pressure to hit arbitrary deadlines and heated debates over how fast one developer is versus another.
Remember, a story point is a blend of complexity, risk, and sheer volume of work—not duration. An eight-point story isn't necessarily double the time of a four-point story; it's just twice the overall effort.
How to Fix It: Be a fierce defender of the abstract nature of points. When someone asks for a time conversion, steer the conversation back to the idea that points measure "bigness," not "longness." Re-anchor your team to your baseline story and remind them that every estimate is a comparison to that reference point, not to a ticking clock.
Mistake 2: Using Velocity to Compare Teams
Another cardinal sin is using velocity as a weapon to compare the performance of different Scrum teams. A manager might see that Team A averages 40 points per sprint while Team B averages 25 and jump to the conclusion that Team A is "better" or "more productive." This is completely wrong because each team’s point scale is unique to them.
Team A's "5" could represent the exact same amount of work as Team B's "8." Comparing their raw velocity is like comparing 50 US dollars to 50 Japanese yen without knowing the exchange rate—the numbers are meaningless without context. This practice only incentivizes teams to inflate their estimates to look good, which completely destroys the reliability of their forecasts.
How to Fix It: Take the time to educate stakeholders. Explain that velocity is a capacity planning tool for a single team and nothing more. It’s for predictability, not for performance reviews.
Mistake 3: Letting Managers Influence Estimates
It happens all the time in Planning Poker. A manager, product owner, or senior leader chimes in with, "Oh, that seems simple enough. Surely it's not more than a 3." Whether they mean to or not, this kind of comment puts subtle pressure on the team. Developers might second-guess themselves and vote lower than they truly believe, leading to wildly inaccurate estimates and overstuffed sprints.
The estimation process has to be a safe space where the development team can have an open and honest conversation about the work ahead.
How to Fix It: The Scrum Master's job is to protect the integrity of the session. A polite reminder that only the people doing the work get to estimate it is often enough. If the influence continues, you might need to set a ground rule that observers can watch but not speak during the actual voting.
Mistake 4: Point Inflation Creeping In
Over months or years, a team’s internal definition of a story point can start to drift. This is often called "point inflation," where tasks that used to be a '3' are now consistently getting estimated as a '5'. It can happen for all sorts of reasons—new people join, old ones leave, or the team simply forgets what their original baseline felt like.
The danger here is that the team's velocity might look like it's increasing, but they aren't actually delivering more value. The numbers are just getting bigger.
How to Fix It: Recalibrate every once in a while. Every few months, pull out your original baseline stories—those well-understood tasks you all agreed were a '2' or a '3'. Run a quick estimation exercise on them again and see if the team’s consensus is still the same. This simple check-in helps keep your scale consistent and ensures your velocity remains a useful, reliable metric.
Frequently Asked Questions About Story Points
As your team starts getting the hang of story points, you'll inevitably run into a few tricky situations. These aren't just theoretical problems; they're the real-world bumps in the road that test how well you understand the art of agile estimation. Let's tackle some of the most common questions that pop up.
Should We Point Bugs or Technical Debt?
This is the classic debate, and you'll find smart people on both sides. One popular camp says to point everything—new features, bugs, chores, you name it. The logic here is simple: it’s all work, so it should all be counted. This gives you the most honest look at where the team's time and effort are truly going, making all that invisible work visible in your velocity.
The other approach is to set aside a fixed capacity for this kind of unplanned work. For instance, a team might agree to reserve about 20% of their sprint for chasing down bugs and paying off technical debt. With this method, they only assign points to new user stories, keeping their velocity metric purely focused on delivering new value.
So which way is right? It really depends on what you want to measure. If you need a true gauge of the team's total output, point it all. If your main goal is to track the pace of new feature delivery, the capacity allocation model is probably a better fit.
What if the Team Cannot Agree on an Estimate?
It's Planning Poker time, and the votes are in: one developer holds up a '3', while another reveals a '13'. Don't panic! A huge gap like this is actually a good thing—it’s a feature of the process, not a bug. It’s a massive signpost pointing directly to a difference in understanding, and uncovering that is the whole point of the exercise.
The goal isn't to just meet in the middle or average the numbers. Instead, have the highest and lowest estimators talk it out. This conversation almost always unearths a hidden complexity, a forgotten dependency, or a piece of crucial information that one person had and the other didn't. After that quick chat, have everyone re-vote. You'll be amazed how much closer the estimates become.
How Does a Brand New Team Estimate Without Data?
When a team is brand new, that first sprint planning session can feel like you're throwing darts in the dark. Without any historical velocity, how can you possibly know what you can accomplish? The short answer is: you can't. And that's completely okay.
Your goal in the first couple of sprints isn't pinpoint accuracy. It's to start building the historical data you need to establish a reliable velocity. Get the team together, make your best collaborative guess about what you can pull into the sprint, and just get started. After two or three sprints, you’ll have a baseline velocity that will make future planning feel much more grounded in reality.
Ready to make your estimation sessions smoother and more effective? Scrum Planning Poker offers a free, simple tool for remote and co-located teams to estimate with clarity. Start your first session in seconds at https://onlineplanningpoker.com.