
What Is Velocity in Scrum Explained
In the world of Scrum, velocity is one of the most talked-about yet misunderstood metrics. Put simply, it’s a measure of the amount of work a development team gets done during a single sprint. It's usually calculated in story points and gives you the team's average capacity for delivering completed work—think of it less as a speedometer and more as a reliable gauge of what's possible.
Understanding Scrum Velocity for Predictable Delivery
Picture a professional moving crew. You wouldn't judge their performance by how fast they run back and forth to the truck. Instead, you'd look at how many boxes they can consistently and safely move in a single day. That steady, sustainable pace is a perfect analogy for what velocity means for a Scrum team. It's not a tool for judging individual performance; it's a planning tool for the entire team.
Velocity helps answer one crucial question: "Given how we've performed in the past, how much work can we realistically take on in our next sprint?" By looking at the total story points from work completed in previous sprints, a team can find an average. This simple number helps them forecast their capacity with much more confidence, shifting their planning from pure guesswork to data-informed decisions.
What Velocity Is and What It Is Not
To use velocity well, you have to understand its limits. It’s a measure of output (how much stuff we built), not outcome (the value that stuff delivered). Its real job is to make planning and forecasting easier and more accurate.
One of the most common traps teams fall into is treating velocity as a target that must always go up. This almost always backfires, leading to some pretty negative side effects:
- Inflated Estimates: To make the numbers look better, teams might start giving tasks higher story point values, which completely undermines the metric's purpose.
- Reduced Quality: When the pressure is on to "hit the number," teams often cut corners, skip vital testing, or let technical debt pile up.
- Damaged Morale: Using velocity to compare different teams or individuals creates a toxic, competitive atmosphere that kills collaboration and trust.
Velocity is a reflection of a team's entire system—its people, its processes, and its tools. It’s a gauge, not a gas pedal. The true goal isn't a higher number, but a stable and predictable one. That predictability is what builds trust with stakeholders and allows the team to work at a sustainable pace without burning out.
The Foundation of Agile Forecasting
At its heart, velocity is the sum of story points from all the backlog items a team fully completes in one sprint. While a team might average anywhere from 30–50 story points per sprint, the specific number is far less important than its consistency over time. Teams find their baseline by averaging their velocity over the last few sprints, which creates a much more reliable foundation for planning what's next. To dig deeper into the basics, you can learn more about the fundamentals of velocity in Agile from experts at 6sigma.us.
To make these concepts even clearer, here’s a quick summary of how everything fits together.
Scrum Velocity at a Glance
This table breaks down the core concepts that make up Scrum velocity, giving you a quick reference for what each term means and why it matters.
| Concept | Brief Explanation | Primary Purpose |
|---|---|---|
| Velocity | The average amount of work a team completes in a sprint, measured in story points. | To forecast future sprint capacity and assist in release planning. |
| Story Points | A relative unit of measure for estimating the effort required to complete a backlog item. | To quantify work without tying it to specific hours, focusing on complexity and effort. |
| Sprint | A fixed time-box (e.g., two weeks) during which a team works to complete a set amount of work. | To provide a consistent cycle for development, feedback, and delivery. |
With these building blocks in place, you can see how velocity serves as a practical tool rather than just another number to track on a chart.
How to Calculate Your Team's Scrum Velocity
Figuring out your team's velocity isn't rocket science, but it does take some discipline. The whole process hinges on one key thing: having a product backlog filled with user stories that have already been estimated. Before you even think about starting a sprint, your team needs to assign story points to the work they plan to tackle. Remember, these points are all about relative effort and complexity—they have nothing to do with hours or days.
Let's walk through an example. Imagine a brand-new team, we'll call them the "Innovators," getting ready for their first few two-week sprints. They've got a backlog of user stories, and they’ve used a technique like Planning Poker to estimate the most important items. This kind of collaborative estimating is great because it gets everyone on the same page about the work involved. If this is new territory for your team, it’s worth checking out how remote teams master story point estimation to get those initial estimates on solid ground.
The Step-by-Step Calculation Process
The actual math is simple. When a sprint ends, you just add up the story points for every user story that is 100% complete. If a story is half-done or even 99% done, it counts for zero. This "all or nothing" rule is non-negotiable; it's what keeps the metric clean and trustworthy.
Let's see how the Innovators team performs over their first three sprints:
Sprint 1: The team pulls in five user stories, totaling 25 story points. When the sprint review comes around, they've completely finished four of them, worth a combined 3, 5, 5, and 8 points. A 4-point story is almost there but isn't quite finished.
- Completed Points: 3 + 5 + 5 + 8 = 21 points
- That unfinished 4-point story goes right back into the product backlog.
Sprint 2: The team is feeling a bit more in sync and decides to take on 28 story points. This time, they nail it, completing every single item they committed to.
- Completed Points: 28 points
Sprint 3: A team member is on vacation for a few days, so they wisely plan for a bit less work, committing to 22 story points. They successfully deliver all of it.
- Completed Points: 22 points
This flow shows how work is pulled from the backlog, completed during the sprint, and then becomes the data you use to calculate velocity.
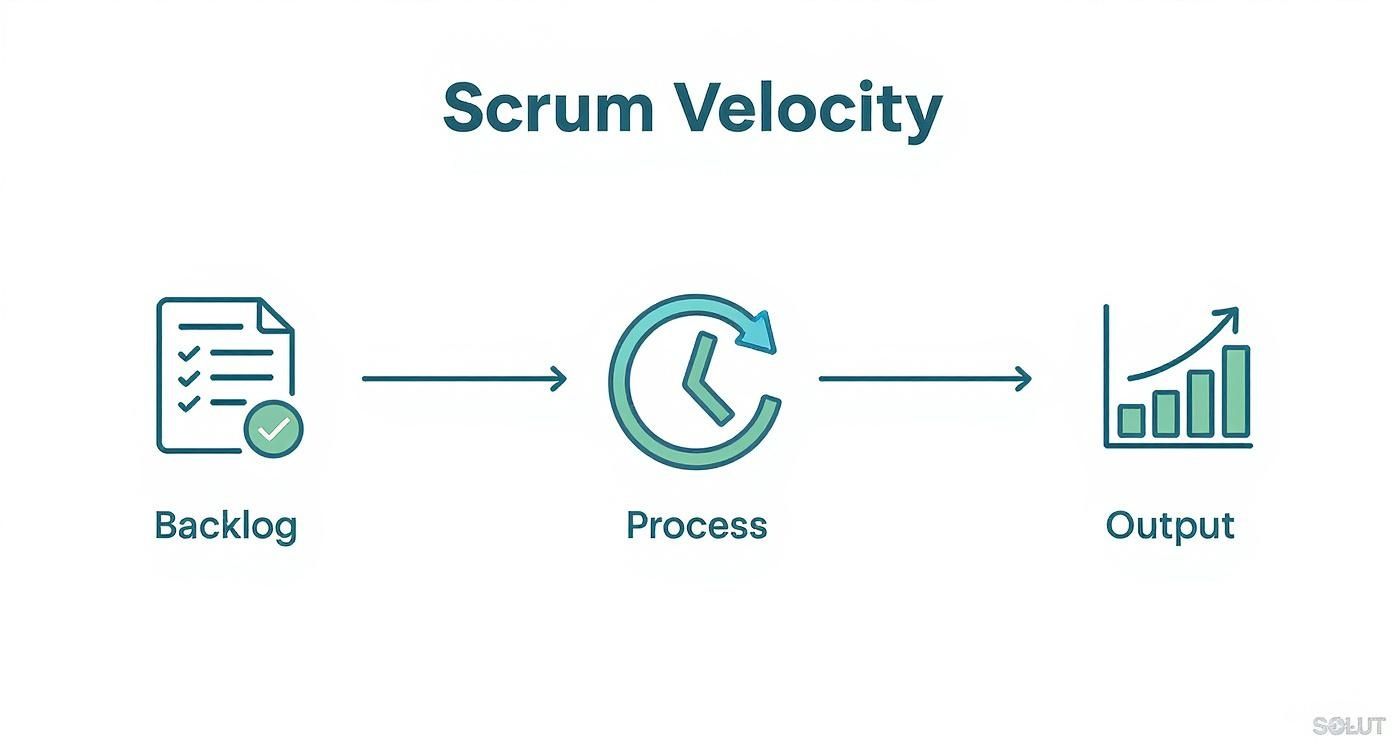
This visual breaks it down perfectly: your estimated backlog is the input, the sprint is where the magic happens, and the finished work is the output that feeds your velocity data.
Finding a Stable Average
The number from a single sprint doesn't tell you much. It's just one data point, a snapshot in time. The real magic of velocity happens when you start averaging it over several sprints. Most teams find that a rolling average of the last three to five sprints gives them a much more stable and predictable baseline, smoothing out the natural ups and downs.
Key Takeaway: Velocity is an average, not a target. Its power is in forecasting what your team can handle in the future based on what it's actually done in the past. Your team's velocity will fluctuate—and that's okay!
Let's go back to the Innovators. After their third sprint, they can calculate their first real average velocity:
- Calculation: (Sprint 1 + Sprint 2 + Sprint 3) / 3
- Result: (21 + 28 + 22) / 3 = 71 / 3 = 23.67
It’s common to round this, so let's call it 24 story points. This number is now their first truly reliable metric for planning. When they sit down for their Sprint 4 planning meeting, they can say with real confidence, "Based on our track record, we can probably complete around 24 story points of work." That’s a world away from just guessing.
As the Innovators complete more sprints, they'll keep updating this rolling average. Over time, this will give them an increasingly accurate picture of their sustainable pace.
Using Velocity for Accurate Sprint Forecasting
Once your team has a few sprints under its belt and you've found a stable average velocity, you've unlocked its real power: forecasting. This isn't about pulling numbers out of thin air; it’s about using your team’s own history to make solid, data-backed commitments.
A predictable velocity changes the whole conversation. You stop asking, "So, what do we think we can do?" and start asking, "What does our data show we can realistically accomplish?" This simple shift turns sprint planning from a high-pressure guessing game into a calm, pragmatic discussion. Instead of cramming the sprint with wishful thinking, the team simply looks at their average velocity and pulls in that much work from the backlog. It’s a foundational habit for any sustainable, high-performing Scrum team.

This approach is also a massive trust-builder. Nothing tanks team morale or stakeholder confidence faster than a string of failed sprints. When a team consistently delivers what it forecasts, everyone from the product owner to the CEO starts to trust their ability to execute.
From Sprint Planning to Release Forecasting
While velocity is a lifesaver for short-term sprint planning, its usefulness doesn't stop there. It's also one of your best tools for mapping out longer-term release plans and giving stakeholders a realistic idea of when that big new feature might actually ship.
Let's walk through a common scenario. Imagine your team has settled into a steady average velocity of 25 story points per two-week sprint. The product owner has a major new feature (an epic) that needs to be built, and the team has broken it down into smaller stories that add up to 150 story points.
With these two numbers, forecasting is just simple math:
- Total Work: 150 Story Points
- Average Velocity: 25 Story Points per Sprint
- Calculation: 150 (Total Points) ÷ 25 (Points per Sprint) = 6 Sprints
So, all things being equal, the team will likely need six two-week sprints—or about twelve weeks—to finish the entire epic.
This forecast isn't a guarantee carved in stone. It's a projection based on the best information you have right now. Its true value is creating a shared, realistic understanding of the timeline from day one.
This method also makes it easy to visualize how things are going. Tools like burnup charts are perfect for this, as they track the total project scope against the work your team completes over time. Your velocity essentially determines the slope of that "work completed" line, giving everyone a clear visual on whether you're on track to hit the target.
Adjusting Forecasts for Real-World Scenarios
Of course, real-world projects are messy. People take vacations, holidays pop up, and unexpected emergencies always seem to happen. A good forecast has to account for this stuff. Since velocity is a direct reflection of your team’s capacity, any change in capacity means you need to adjust your expected velocity.
Let's go back to our team with a velocity of 25. In the next sprint, one of their five developers is taking a well-deserved vacation for the full two weeks. That's a 20% drop in the team's capacity for that sprint.
The smart move is to adjust the forecast accordingly:
- Adjusted Velocity: 25 Story Points × 0.80 = 20 Story Points
For that sprint, the team should only plan to take on about 20 story points instead of their usual 25. This isn't a sign of failure; it's a proactive adjustment that keeps the plan grounded in reality and saves the team from overcommitting. When you treat velocity as a flexible guide instead of a rigid target, you can navigate the inevitable bumps in the road while still maintaining a predictable pace.
Improving Velocity With Better Estimation Practices
A team’s velocity stands on the accuracy of its story point estimates. When those estimates drift or lack a common benchmark, your velocity chart looks more like noise than a signal—forecasting becomes guesswork.
Consider laying a foundation for a house: if the first measurements are off, every wall and beam ends up misaligned. In Scrum, shaky story point estimates create a similarly unstable base for sprint planning and release forecasts.
The aim isn’t pinpoint precision but consistent relative sizing. Get your estimation process right, and you’ll see your velocity settle into a dependable rhythm.
Introducing Planning Poker For Consensus
Planning Poker is a simple yet powerful way to bring every voice into the estimation process. It turns solo guesses into a team-driven discussion, cutting through individual bias.
Steps To Run A Session:
- The Product Owner presents a user story and fields clarifying questions.
- Each team member picks a card in private (choose from the Fibonacci-like set 1, 2, 3, 5, 8, 13).
- All cards are revealed at once.
Revealing together is key. It prevents “anchoring,” where the first number spoken sways everyone else’s thinking.
The real value of Planning Poker isn't just the final number. It's the discussion that happens when the numbers are far apart. This conversation is where hidden complexities are uncovered, assumptions are challenged, and a shared understanding of the work is truly built.
When one developer calls out 3 and another sees 13, you’ve struck a learning moment. Invite those two to explain their viewpoints. Usually, a quick re-vote lands the team on a more accurate estimate. For a deeper dive, you can explore a complete guide to Planning Poker and how to estimate user stories to get your team started.

How Better Estimates Lead To Stable Velocity
Better inputs yield a steadier output. Once your team adopts a uniform, discussion-driven approach to estimation, the benefits ripple across every sprint.
Key Benefits Of Improved Estimation:
- Increased Consistency: A shared sense of what a “3-point” story feels like keeps your velocity smoother from sprint to sprint.
- Deeper Understanding: Early conversations expose unclear requirements, slashing the chance of mid-sprint surprises.
- Improved Predictability: A gentle wave in your velocity chart turns forecasting from guesswork into a reliable tool.
Ultimately, refining your estimation process isn’t about chasing a bigger number. It’s about crafting a predictable delivery cadence that keeps the team energized, wards off burnout, and gives stakeholders a clear view of what’s ahead.
Common Velocity Pitfalls and How to Avoid Them
While velocity is a fantastic tool for forecasting, it’s also one of the most misused metrics in the entire Agile world. When people don't quite get it, velocity can quickly go from a helpful guide to a source of friction, distrust, and shoddy work.
The first step to avoiding these traps is understanding them. Most problems crop up when velocity is treated like a performance report card instead of what it truly is: a planning tool. It's meant to reflect a team’s capacity, not to be a weapon to squeeze out more work.
Comparing Velocity Between Teams
This is probably the biggest and most destructive mistake people make. Let's say you have two teams: Team A has a velocity of 25, and Team B has a velocity of 40. It's tempting to think Team B is the "better" or more productive one. That conclusion is totally meaningless.
Here's why: story points are relative and unique to each team. What one team calls a 5-point story, another might call an 8-pointer. It all depends on their specific skills, experience, and their collective gut feeling about complexity. Comparing their velocity is like comparing apples and oranges—they just aren't measured on the same scale.
- The Damage: This kind of comparison breeds unhealthy competition and resentment. It also pushes teams to inflate their story point estimates just to "look good," which completely destroys the metric's value for forecasting.
- How to Avoid It: Treat each team’s velocity as their own private number. It’s for their planning and their forecasting, not for a public leaderboard.
Using Velocity as a Performance Metric
When velocity gets tied to performance reviews, bonuses, or promotions, it immediately stops being useful. The team’s focus shifts from delivering real value to just hitting a number. This is a recipe for disaster and goes against the very spirit of Agile.
The moment velocity becomes a target, it ceases to be a useful measure. Teams will game the system to hit the number, often at the expense of what truly matters—quality and customer value.
This kind of pressure forces teams to cut corners. They might skimp on testing, ignore technical debt, or work unsustainable hours, which leads straight to burnout. This not only crushes morale but also tanks the quality of the product over the long haul. You can learn more about how this and other estimation errors can derail your Sprints in our guide on 5 common Planning Poker mistakes killing sprint planning.
Demanding Constant Velocity Increases
Another classic anti-pattern is expecting velocity to go up and up forever. A healthy, mature team's velocity should actually stabilize, not grow indefinitely. A stable, predictable velocity is the whole point—it’s what makes forecasting reliable!
Pushing for constant increases leads to the same old problems: inflated story points, declining quality, and burnt-out developers. Sustainable pace is a core Agile principle, and this practice tramples all over it.
Now, that doesn't mean you can't improve. One case study from a large financial firm showed that by focusing on improving their processes—not just the number—teams saw a 40% velocity increase after just one Sprint and a whopping 280% improvement after four. This helped them get back on track after months of delays. Learn more about how they achieved these results and delivered on schedule.
The key takeaway is that velocity is a diagnostic tool. If it suddenly drops, it's a signal to ask "Why?" and look for what's getting in the team's way. It is not a stick to demand more work. By sidestepping these common pitfalls, you can keep velocity as a powerful and positive tool that helps your team plan better and become more predictable.
The Real Power of a Stable Velocity
It's easy to get lost in the charts and numbers, but the true magic of Scrum velocity is the stability it creates for everyone involved. When you have a predictable, stable velocity, it's more than just a metric. It becomes the bedrock for building trust, boosting morale, and fostering a healthier, more sustainable way of working. Once a team can reliably forecast what they can deliver, the entire dynamic changes from a stressful guessing game to confident, collaborative planning.
This predictability has a huge impact on stakeholder relationships. Imagine a product owner who sees the team consistently deliver what they forecasted, sprint after sprint. That builds incredible confidence. Suddenly, those tense conversations about arbitrary deadlines and high-pressure demands are replaced by data-driven discussions about what’s genuinely possible. It nurtures a partnership built on transparency and respect, not top-down directives.
From Pressure Cooker to Sustainable Pace
A stable velocity also works wonders for team morale. Nothing burns a team out faster than the constant pressure of chasing unrealistic goals. But when a team uses its own historical average to pull in a manageable amount of work, they’re empowered. They get to set their own achievable goals.
This sense of ownership gets rid of that frantic, end-of-sprint crunch time. Developers can finally focus on what they do best: building a great product. The conversation shifts from "how fast can we go?" to "what can we sustainably deliver?" This gives the team the breathing room they need for proper testing, thoughtful design, and even chipping away at technical debt.
The ultimate goal of velocity isn't to get the highest number possible—it's to get a predictable one. Predictability is the foundation of trust, and trust is what high-performing agile teams are built on. It enables a sustainable pace that values quality and long-term success over short-term heroics.
The Business Case for Predictability
The benefits of a stable velocity make a powerful business case for doing Agile right. Looking back, teams that truly nail Scrum often see incredible jumps in their output. One famous Bell Labs audit of a team at Borland found their velocity was 50 times faster than with traditional Waterfall methods. On a broader scale, high-performing Scrum teams often report average velocity improvements of 450% over their first 10 Sprints. You can dig into more of these impressive Agile statistics and performance gains from Parabol.
These numbers tell a clear story: when you free teams from the constant stress of arbitrary deadlines, they can focus on delivering real value. A stable velocity is what unlocks that potential, turning a team's workflow from chaotic and reactive to focused and efficient. It’s solid proof that working smarter, not just harder, leads to better products, happier teams, and a healthier bottom line.
Frequently Asked Questions About Scrum Velocity
Even with a good grasp of the basics, teams often run into practical questions about velocity. Let's tackle some of the most common scenarios that pop up in the real world. Think of this as a guide to help you use velocity for smarter planning, not for setting unhealthy targets.
What happens to velocity if a team member goes on vacation?
It goes down, and that’s perfectly fine. If a team member is out for a sprint, your team's total capacity is lower. It's only natural that you'll complete fewer story points.
The key is to plan for this. Don't base your sprint commitment on your average velocity; base it on the actual availability of your team for that specific sprint. This is a perfect example of how velocity is a reflection of real-world capacity, not a rigid number to hit at all costs.
Should we re-estimate stories that are not completed in a sprint?
Definitely not. A story's point value is its point value. If a story isn't finished, it simply moves back into the product backlog with its original estimate intact.
Why? Because velocity is a measure of fully completed work. Changing the estimate on an unfinished item would distort your data and make your velocity a less reliable forecasting tool down the road.
A few things to keep in mind:
- Always adjust your sprint commitments based on your team's true capacity.
- Treat velocity as a guide for planning, never as a performance metric to judge your team.
- Embrace the reality that velocity will fluctuate from sprint to sprint.
- Focus on the story points you actually complete to inform future planning.
Adjusting for Capacity Changes
Is a higher velocity always better?
Not at all. In fact, a sudden spike in velocity can be a red flag. It might mean the team is cutting corners on quality, rushing through work, or simply inflating their story point estimates to look more productive.
The real goal isn't a higher number—it's a consistent and predictable velocity. A stable velocity is what allows you to make reliable forecasts. Consistency will always be more valuable than chasing a bigger number.
How long does it take for a new team's velocity to stabilize?
Give it some time. Most new teams need about three to five sprints to find their rhythm and establish a stable average velocity.
The first few sprints can be a bit of a rollercoaster. The team is still learning to work together, getting the hang of the product, and refining how they estimate. Once you have a few sprints under your belt, that average becomes a much more trustworthy baseline for your planning.
A few tips for this period:
- Pay attention to trends and discuss them in your retrospectives to identify issues early.
- Use your retrospective action items to get better at estimating and smoothing out your workflow.
- If something big changes (like a new team member joining), be prepared to adjust your forecasts.
Comparing Across Teams
Can we compare velocity across different teams?
This is a hard no. It’s like comparing apples and oranges. Every team's definition of a "story point" is unique to them. Their skills, experience, and the complexity of their work are all different.
Turning velocity into a leaderboard between teams only encourages bad habits, like estimate inflation, and creates unhealthy competition. Each team's velocity is their own internal tool, meant for their planning and nobody else's.
Key Takeaways for Scrum Velocity
| Question | Quick Guidance |
|---|---|
| Vacation impact | Plan for lower capacity; don't chase the average. |
| Re-estimation | No, keep the original story points. |
| High velocity | Aim for consistency and predictability, not just a big number. |
| Stabilization period | It typically takes 3–5 sprints for a team's velocity to settle. |
A stable velocity empowers teams and stakeholders by creating trust through consistent delivery rather than chasing arbitrary numbers.
Ready to improve your estimation accuracy and get a reliable, predictable velocity? Try Scrum Planning Poker free at https://onlineplanningpoker.com. It runs smoothly in any browser and on mobile.