
A Practical Guide to Estimating Story Points
Story points aren't about clocking hours; they're about gauging effort. Instead of asking, "How many hours will this take?" an agile team asks, "How big is this compared to other things we've done?" This simple shift helps teams create much more reliable forecasts by focusing on the combined complexity, uncertainty, and volume of work—all without the pressure of a ticking clock.
What Are Story Points and Why Do They Matter
Let's say I ask you to guess how long it will take to move a pile of rocks. It’s a trick question, right? You'd immediately have follow-up questions: Are the rocks big or small? Heavy or light? Spread out or in one neat pile? Trying to slap a specific hour count on it is a recipe for being wrong, because you can't possibly know all the variables upfront.
This is exactly why time-based estimates so often fail in software development.
Now, what if we tried a different approach? Instead of guessing the hours, you just compare the task to other things you've moved. Moving this pile of rocks feels harder than moving a bag of feathers, but it’s definitely easier than moving a car. That, in a nutshell, is the core idea behind story points.
Story points are an abstract unit of measurement. They don't translate to hours or days. They represent the overall effort a team believes is needed to get a user story completely done. It's a powerful change because it uncouples the estimate from any one person's individual speed and gets the entire team to agree on the relative size of the work.
The Three Pillars of a Story Point
When your team sits down to estimate, you’re not just pulling numbers out of thin air. You’re collectively evaluating three key factors that make up the total effort:
- Complexity: How hard is this to actually build? Does it require a niche skill set, or is the logic just really tricky to get right? A task involving a complex algorithm is more complex than a simple text change.
- Uncertainty: How much do we not know? Are the requirements crystal clear, or are there big question marks? Dependencies on other teams or unfamiliar technologies can crank up the uncertainty.
- Volume: Simply put, how much is there to do? This isn't about difficulty, just sheer quantity. Updating a single form field is low volume; updating that same field across 20 different screens is high volume.
By looking at these three elements together, the team gets a well-rounded view of the effort involved. A task that seems simple on the surface might get a higher point value because it’s full of uncertainty. Likewise, a massive but straightforward task gets a higher estimate because of its sheer volume.
A story point is a relative unit of measure, decided upon and used by individual Scrum teams, to provide relative estimates of effort for completing requirements. It’s about the size of the box, not how long it takes to carry it.
The Psychological Shift from Hours to Points
Moving away from time-based estimates is more than just a process tweak; it’s a fundamental shift in mindset. This idea isn't new. Early agile pioneers used playful units like "Gummi Bears" or "Nutella Points" specifically to break the mental link to time.
Using an abstract unit like a story point frees developers from the pressure of committing to an exact timeframe, which is often a losing game in the unpredictable world of software. It allows a senior developer who could finish a task in a day and a junior developer who might take three days to both agree that the task is, say, a "5-pointer" in terms of its relative size. This levels the playing field and fosters much healthier collaboration. You can learn more about the psychological benefits and history of story points.
How to Start Estimating Story Points
Jumping into story points isn't about memorizing complex formulas. It's about building a shared language with your team so everyone understands what "work" feels like. Your first move isn’t to point your entire backlog; it's to find your North Star—a single, simple task that becomes the reference point for everything else.
This first task is often called a reference story or a baseline, and it acts as the yardstick for all your relative sizing. It grounds every future estimation discussion in a real, concrete example everyone on the team has already agreed on.
Find Your Baseline Story
Before you even think about holding an estimation session, your team needs to pick a small user story from your backlog that everyone understands inside and out. This isn't some theoretical exercise; it has to be a real piece of work.
- Pick something simple: A minor bug fix or a tiny UI tweak often makes for a great reference story.
- Make sure everyone gets it: Every single person on the development team needs to fully grasp the requirements and what needs to be done. There can't be any ambiguity.
- Give it a low value: Assign this story a 2 or a 3 on the Fibonacci scale. This anchors your entire scale, leaving room for tiny "1-point" tasks while setting a clear benchmark for everything bigger.
Think of your reference story like a measuring cup. Once everyone agrees on what "one cup" looks like, you can accurately measure out half a cup or five cups with confidence. Without that initial standard, every measurement would just be a wild guess.
This process is all about translating the abstract idea of effort into a practical forecast your team can actually use.
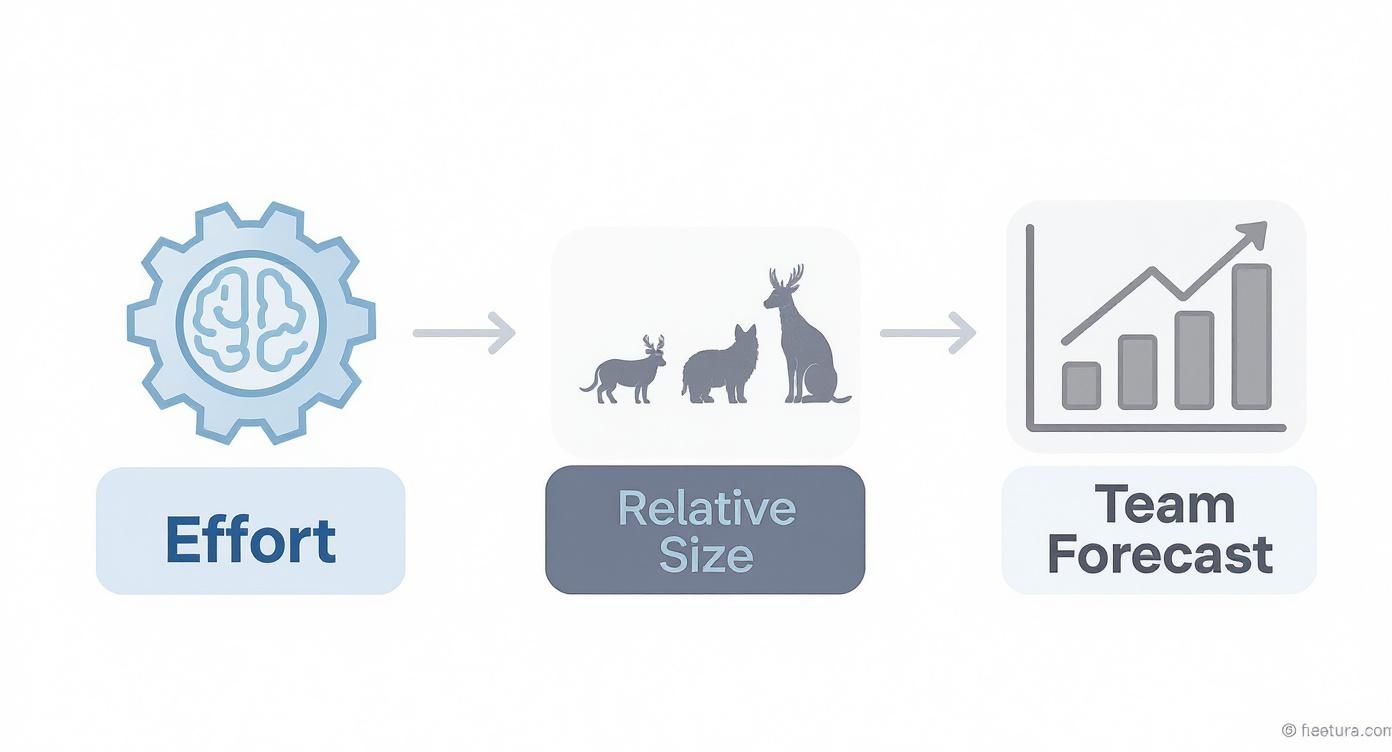
As the visual shows, forecasting becomes more reliable when it’s not about guessing hours, but about consistently comparing the effort and size of new tasks against these established benchmarks.
Run Your First Estimation Session
Once you've got your reference story locked in, you're ready to run your first estimation meeting. For the session to be productive, everyone needs to know their role.
Team Roles in Estimation:
- The Product Owner: They present the user story, explaining why it matters and answering any functional questions from the team. Their job is to provide clarity, but they do not get a vote on the final estimate.
- The Scrum Master: They are the facilitator. They keep the conversation on track, make sure the rules (like in Planning Poker) are followed, and ensure every voice is heard. Their goal is to guide the team to a consensus.
- The Development Team: These are the only people who vote. They are the ones doing the work, so they ask technical questions, discuss implementation, and ultimately decide on the story point value by comparing the new item to the reference story.
After the Product Owner presents a story, the team will dig in with questions to clarify complexity, risks, and the sheer volume of work. For distributed teams, it’s critical to have a solid process, which is why it helps to understand how remote teams master story point estimation.
The core of the discussion always comes back to one question: Is this new task smaller, the same size, or much larger than our "2-point" reference story?
Why Use the Fibonacci Sequence
You've probably noticed that most agile teams don't just use a 1-10 scale. Instead, they stick to a modified Fibonacci sequence: 1, 2, 3, 5, 8, 13, 20... This isn't just an arbitrary choice; it serves a very practical purpose.
The gaps between the numbers get wider as they go up (the jump from 8 to 13 is way bigger than from 2 to 3). This intentionally reflects the massive uncertainty that comes with bigger, more complex tasks. After all, is there really a meaningful difference between a "20-point" story and a "21-point" story? Probably not. The Fibonacci scale forces us to admit we can't be that precise.
When the team starts debating between a 13 and a 20, it’s a big red flag. It’s the scale's built-in signal that the story is too big and not well understood. That’s the cue to break the work down into smaller, more manageable pieces that can be estimated with greater confidence.
Popular Techniques for Agile Estimation
Once your team is on board with why you’re estimating with story points, the next big question is how. There's no single right answer here. Different situations call for different methods, and what works beautifully for one team might feel clunky for another.
The goal is to pick a technique that gets people talking, surfaces unspoken assumptions, and helps everyone arrive at a shared understanding of what it will take to get the job done.
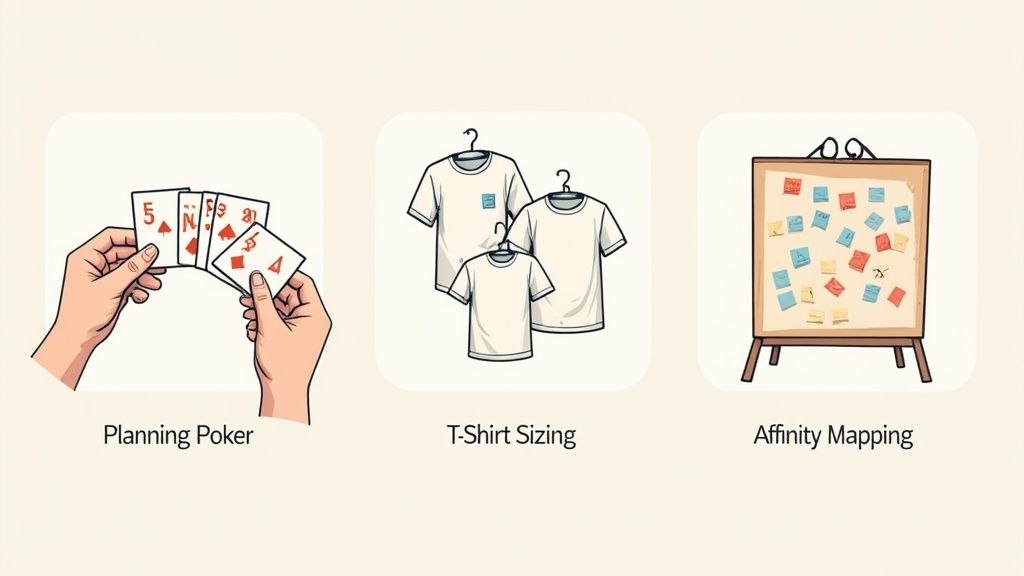
While there are many ways to approach this, a few stand out as team favorites. They're popular because they work, transforming estimation from a solo chore into a genuinely collaborative and insightful team activity.
The Gold Standard: Planning Poker
There’s a reason Planning Poker is the most famous estimation technique out there. It’s a smart, gamified approach that gives everyone an equal voice, which is crucial for preventing the loudest person in the room from steering the conversation.
It's a simple process with a powerful impact:
- Story Intro: The Product Owner walks the team through a user story.
- Q&A Time: The dev team dives in with questions to unpack the complexity, risks, and sheer amount of work involved.
- Private Vote: Here’s the key part. Everyone privately selects a card from their deck (usually following the Fibonacci sequence) that reflects their estimate. Keeping it private prevents people from being swayed by others.
- Cards on the Table: On the count of three, everyone reveals their card. If the estimates are all in the same ballpark, you can quickly agree on a final number.
- Unpack the Outliers: If you see a 3 and a 13 for the same story, you’ve hit gold. The people with the highest and lowest estimates explain their thinking. This is where you uncover massive misunderstandings or overlooked dependencies.
- Vote Again: The team keeps discussing and re-voting until everyone converges on a single, agreed-upon number.
The real value of Planning Poker isn't the number itself. It’s the rich, focused conversation that happens when estimates don't align. It forces the team to get on the same page, which is worth far more than any estimate.
You can explore a deeper dive into these and other powerful agile estimation techniques to find the perfect fit for your team.
T-Shirt Sizing for the Big Picture
Sometimes you need a quick read on a huge backlog without getting lost in the weeds. That’s where T-Shirt Sizing (XS, S, M, L, XL) comes in. It’s a high-level, low-fuss method that’s perfect for initial backlog grooming or long-term roadmap planning.
Instead of debating specific numbers, the team simply sorts stories into rough size buckets. An "XS" might be a trivial text change, while an "XL" is a monster feature that obviously needs to be broken down into smaller pieces.
T-Shirt Sizing is all about getting a quick sense of scale. It helps teams prioritize and plan from a 30,000-foot view, saving the nitty-gritty pointing for when stories are actually ready for a sprint.
This approach is fast, collaborative, and keeps the conversation focused on relative effort. Later on, as those items get closer to development, you can map those sizes to your team’s story point scale (e.g., Small = 2-3 points, Medium = 5-8 points).
Affinity Mapping for a Mountain of Stories
Staring down a backlog with hundreds of items? Estimating them one by one would be an absolute nightmare. Affinity Mapping (or Affinity Estimation) is built for exactly this scenario, allowing you to size a massive volume of stories in a fraction of the time.
The process is surprisingly simple. Each story is written on a sticky note. One person places the first story on a wall. The next person takes a story and places it to the right if they think it's bigger, to the left if it's smaller, or in the same column if it feels about the same size.
The whole team continues this process, often in silence, creating columns of similarly-sized work. Once all the stickies are on the wall, the team discusses the groupings and assigns story points to each column. It's visual, tactile, and incredibly efficient—a perfect tool for kicking off a new project or planning out the next quarter.
Which Estimation Technique Is Right for Your Team?
Choosing the right method depends entirely on your context—what you're estimating, how much detail you need, and your team's personality. There's no "best" technique, only the one that's best for you right now. This table breaks down the common options to help you decide.
| Technique | Best For | Key Advantage | Potential Drawback |
|---|---|---|---|
| Planning Poker | Detailed Sprint Planning | Drives deep conversation and uncovers hidden complexities. | Can be slow for large numbers of stories. |
| T-Shirt Sizing | High-Level Roadmapping & Backlog Grooming | Extremely fast for getting a rough sense of scale. | Too imprecise for sprint-level commitments. |
| Affinity Mapping | Sizing Large Backlogs Quickly | Highly collaborative and very efficient for bulk estimation. | Lacks the deep discussion of individual stories. |
| Dot Voting | Prioritizing a Small Number of Items | Simple, fast, and democratic way to gauge team priorities. | Can turn into a popularity contest, not a true estimate. |
| Bucket System | Hybrid of Speed and Detail | Faster than Planning Poker but more granular than T-Shirt Sizing. | Can be complex to set up and facilitate initially. |
Ultimately, the best approach is the one that gets your team talking and leads to a shared understanding of the work. Don't be afraid to experiment with different techniques—or even combine them—to find what truly clicks for your crew.
Refining Your Estimates for Better Predictability
Getting your initial story point estimates down is a great start, but it's really just the beginning. The magic happens when your team starts turning those educated guesses into a reliable way to forecast work. This doesn't happen overnight, of course. It takes a real commitment to improving, regularly checking in on your process, and learning from what you’ve already done.
Think of it this way: great estimation is a skill that gets sharper with practice and feedback. By creating simple feedback loops, your team can get past the initial "number assigning" phase and start building a predictable, sustainable rhythm for getting work done. This whole refinement process is what gives you the confidence to make commitments you can actually keep.
Anchor Your Estimates with Reference Stories
If you want to be predictable, you have to be consistent. A "5-point" story should feel more or less the same size this sprint as it did three sprints ago. The best way to achieve this is by creating and maintaining a library of reference stories. These are just examples of work you've already finished that everyone on the team can use as a benchmark.
Your library shouldn't just be a list of tickets. It should have clear examples for each of the main values on your estimation scale—a classic 2-pointer, a solid 5, a beefy 8, and so on. When it's time to estimate a new item, the team can simply ask, "Is this new thing bigger or smaller than our reference '5-pointer'?" This simple question grounds the whole conversation in shared, real-world experience instead of vague feelings.
To get your reference library started:
- Pick clear examples: Choose stories that the team understood well and where the final effort pretty much matched the initial guess.
- Write them down: Keep a simple, easy-to-find list (a wiki page or shared doc works great) with the story title, its final point value, and a quick note about what it was.
- Review and update it: As your team and projects change, so will your understanding. Revisit your library every few months to make sure the examples still make sense.
Master Your Rhythm with Team Velocity
So how do you turn these abstract points into a real-world forecast? That's where velocity comes in. Simply put, velocity is the average number of story points your team actually completes in a sprint. It’s not a target or a weapon—it's just a straightforward, data-driven measure of your team's sustainable pace.
Calculating your velocity is easy: just add up the points for all the stories your team got to "Done" in a sprint. After you've done this for three or four sprints, you can average the numbers to get your historical velocity. This number is gold for realistic planning. For a deeper dive, check out our guide on what is velocity in Scrum and how to calculate it.
Velocity is your team's unique signature of productivity. If your team's average velocity is 25 points per sprint, you can confidently tell stakeholders that a feature requiring 50 points of effort will likely take about two sprints to complete. This is data-driven forecasting in action.
The Power of Regular Calibration
To keep your estimates sharp over the long haul, your team should hold regular calibration sessions. This is just a short meeting, maybe once a month, where you look back at a few recently completed stories. The goal is to talk about whether the original estimates still feel right now that the work is done.
For example, you might find a story you estimated as a "3" ended up having a ton of hidden complexity, and in hindsight, it felt more like an "8". Talking through why that happened helps everyone learn and adjust for next time.
This isn't just theory; it works on a huge scale. One global engineering firm was struggling with predictability across its distributed teams. They decided to implement standardized estimation and regular calibration. The results were stunning: within six months, they cut their estimation variance by 47% and boosted their on-time delivery rates by 42%. It’s a powerful testament to how much you can improve by just refining your process. You can discover more insights about how data refines estimation methodologies.
These techniques—building a reference library, tracking velocity, and calibrating estimates—are what transform story pointing from a simple planning exercise into a powerful engine for predictable delivery.
Common Story Point Estimation Mistakes to Avoid
Even the sharpest agile teams can fall into bad habits that slowly chip away at the value of their estimation process. Getting good at story points is a skill, and honestly, avoiding the common pitfalls is just as crucial as learning the right techniques. These mistakes can quickly turn a helpful, collaborative tool into a major source of frustration and wildly inaccurate forecasts.
To protect the integrity of your process, you have to stay vigilant. By understanding what these traps are and why they’re so damaging, your team can make sure story pointing remains a source of clarity and predictability, not confusion.
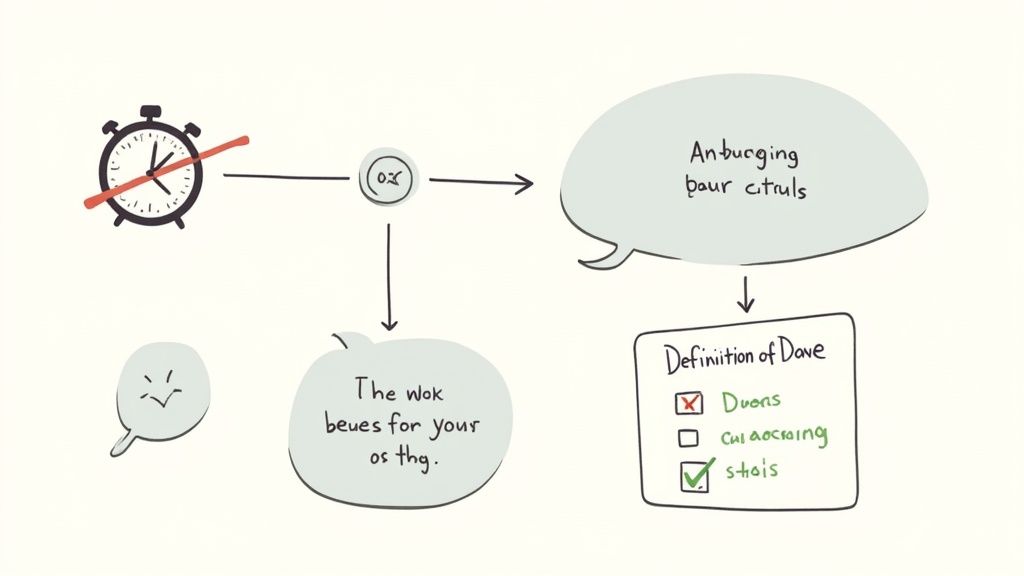
Let's break down the most frequent errors I see teams make and, more importantly, how you can steer clear of them.
Translating Story Points Directly to Hours
This is the cardinal sin of story pointing. The moment someone on your team says, "Okay, so a 3-pointer is about half a day's work," you've just thrown away the biggest benefit of using points. Story points are meant to be abstract—they separate the effort from a specific person's time on a specific day.
When you tie points to hours, you invite back all the problems you were trying to escape in the first place:
- Unnecessary Pressure: Team members feel a squeeze to finish work within a rigid timeframe, even when unexpected roadblocks pop up.
- False Accuracy: A senior developer's "four hours" is a world away from a junior developer's "four hours," but both can usually agree on the relative size of a story.
- Gaming the System: Estimates get padded with buffer time to create wiggle room, instead of reflecting the actual effort involved.
The fix is simple but requires discipline: always frame the conversation around relative size. The only question that should matter is, "Is this bigger or smaller than our reference stories?"
Succumbing to Anchoring Bias
Anchoring bias is a sneaky psychological trap where we latch onto the first piece of information we hear. In an estimation meeting, this happens the second a senior developer or the most confident person on the team throws out their number. Instantly, that number becomes the "anchor" that pulls everyone else's thinking in its direction.
Every estimate that follows is no longer an independent thought; it's just an adjustment based on that initial anchor. This completely defeats the purpose of gathering diverse perspectives to land on a more accurate, collective understanding of the work.
This is exactly why Planning Poker was invented. The simultaneous reveal forces everyone to show their cards at the same time, giving you a genuine, unfiltered snapshot of each person's assessment before the discussion starts. It's a powerful tool against anchoring.
Lacking a Clear Definition of Done
If your team doesn't have a crystal-clear, universally understood Definition of Done (DoD), your estimates are built on a foundation of sand. Does "done" just mean the code is written? Or does it mean the code is written, peer-reviewed, tested, and pushed to a staging environment?
Without a shared DoD, one developer might estimate a story as a "5" thinking only about the coding, while another gives it an "8" because they're factoring in testing and documentation. This kind of inconsistency makes your velocity metrics useless and any attempt at forecasting a complete shot in the dark.
To fix this, your team must:
- Create a DoD Together: Everyone who touches a story—devs, QA, designers—needs to agree on the checklist of what it takes to call something complete.
- Keep It Visible: Post the DoD where everyone can see it during sprint planning and estimation sessions. Don't let it become a forgotten document.
- Apply It Religiously: The DoD is non-negotiable. Every single story must meet every single criterion to be counted toward your team's velocity.
Forgetting to Revisit and Calibrate
Story point estimation isn't a "set it and forget it" activity. A team's understanding of its own work evolves. What felt like a huge "8-point" story six months ago might feel more like a "5" today. That’s a good thing! It means the team is maturing and getting more efficient.
But if you don't pause to check in periodically, your estimates can drift apart, becoming less consistent and less reliable over time. This is why holding quick calibration sessions is so important. Just look back at some recently completed work and ask, "Knowing what we know now, would we still give it the same estimate?" This simple feedback loop keeps everyone aligned and ensures your historical data remains a trustworthy guide for the future.
2. Alternatives and Criticisms of Story Points
While story points are a go-to for many agile teams, they’re not a silver bullet. In fact, they come with some fair criticisms that are worth paying attention to. One of the biggest traps is the false sense of precision they can create.
It’s easy for everyone—from stakeholders to the team itself—to see an “8-point” story and think of it as a fixed, concrete number. We forget that it's just a relative guess about complexity and effort, not a promise etched in stone.
This abstract nature also makes story points tricky when talking to people outside the dev team. Try explaining to the finance department that you need more budget because of "story points completed," and you'll likely get some blank stares. Points just don't translate cleanly into the hours and dollars that the rest of the business runs on.
Shifting Focus to Flow Metrics
Because of these challenges, a lot of teams are starting to look at flow metrics instead. Rather than guessing how big a task is before starting, flow metrics measure how work actually moves through your process. They give you a real, data-backed picture of your team’s delivery speed.
Two of the most useful flow metrics are:
- Cycle Time: This is the clock time from when a task is first picked up ("In Progress") to when it’s completely finished ("Done"). It answers a simple, powerful question: "How long does it actually take us to finish something?"
- Throughput: This just counts the number of work items your team completes in a set time frame, like a week or a sprint. It tells you, "How much stuff can we get done?"
These metrics are catching on because they’re based on observation, not speculation. They show what your team is doing, not what it thinks it might do. That provides a much more solid foundation for making future predictions.
Why Flow Metrics Offer a Compelling Alternative
The real magic of flow metrics is how they’re tied directly to reality. Studies and real-world experience show that using a team's historical cycle time often leads to more accurate forecasts than story points ever could. Because you’re tracking actual time and completion rates, you avoid the messy, often misleading, business of trying to convert abstract points into billable hours—something story points were never meant for. You can dive deeper into the challenges of relying solely on story points to see why this is such a common pitfall.
At the end of the day, this isn't about declaring story points dead. It’s about knowing their limits and understanding the other tools available. By getting comfortable with alternatives like cycle time and throughput, your team can pick the right approach for the right situation. Sometimes that might mean replacing points entirely, and other times it might mean using flow metrics to gut-check and validate your estimates.
Answering Your Questions About Story Points
Even when you've got the basics down, a few common questions always seem to pop up as teams start using story points in the real world. Let's tackle some of the most frequent sticking points.
Getting these right can make all the difference between a frustrating process and a truly effective one.
Can We Relate Story Points to Hours?
This is probably the most common question, and it's a tempting shortcut. But the simple answer is no—you should fight the urge to create a formula like "1 point = 4 hours."
Why? Because doing that completely undermines the whole point of relative estimation. The goal is to separate the size of the work from how long it might take one specific person to do it. Tying points back to hours just reintroduces all the old problems of time-based deadlines and individual pressure.
Think of it this way: points measure the size of a box, not how long it takes to carry it upstairs.
What if the Team Cannot Agree on an Estimate?
First off, don't panic. Disagreement is not a bug; it's a feature. When you get a wild spread of votes—say, a 3 and a 13—it’s a huge red flag that your team isn't on the same page about the work.
This is your cue to talk. Have the people who voted highest and lowest explain their thinking. This simple conversation is incredibly valuable. It almost always uncovers hidden assumptions, missed requirements, or different ideas about the technical approach. The goal isn't to meet in the middle, but to share knowledge until everyone can confidently re-vote.
Should QA and Dev Estimate Separately?
Definitely not. The final story point estimate needs to cover the total effort from the entire team to get a user story to "Done." That means everything is bundled into that one number: design, coding, testing, documentation—whatever is in your Definition of Done.
A story isn't finished when the code is written; it's finished when it's fully tested and delivers value. The final point value must reflect that entire journey, encouraging a shared sense of ownership from everyone on the team.
Run faster, more focused agile estimation sessions with Scrum Planning Poker. Our free, no-signup tool lets you start a session in seconds and bring your team together, whether you're in the same room or across the globe. Get your free tool at https://onlineplanningpoker.com.