
How to Estimate Story Points Without the Guesswork
To estimate story points effectively, you're looking for a collaborative way to size up work, not guess at hours on a clock. It's about measuring the combined effort, complexity, and uncertainty of a task. This lets teams forecast more realistically without the false precision that time-based deadlines often create. The entire goal is to agree on the size of the work, not the exact time it'll take any one person to get it done.
Why Story Points Work Better Than Hour-Based Estimates
Let's be honest: estimating software development in hours is often a losing game. It promises a level of precision that rarely holds up, which inevitably leads to missed deadlines, stressed-out teams, and frustrated stakeholders. Learning to estimate story points changes the entire conversation from "how long will this take?" to "how big is this?"

This shift in perspective is far more than just semantics; it's a fundamental change in how we approach work. Story points became a go-to estimation tool to deal with the "cone of uncertainty" that plagued software projects. Early estimates can be all over the map, but relative sizing helps bring them into focus by concentrating on effort instead of a ticking clock.
The Problem with Time
Estimating in hours almost immediately creates conflict. A senior developer might peg a task at four hours, while a junior developer sees it as a full day of work. Who’s right? In their own way, they both are. Their individual experience dictates their timelines, but arguing over the exact duration is a waste of time. The disagreement happens because we're trying to predict the future with absolute certainty, which is impossible.
Hour-based estimates just can't properly account for the three key ingredients of any task:
- Effort: The sheer amount of work required to get it done.
- Complexity: How many tricky parts or difficult logic paths are involved.
- Uncertainty: The number of unknowns, risks, or external dependencies.
A task could be low-effort but highly complex, or it might be simple but packed with uncertainty because it relies on a shaky third-party API. Hours just can't capture that kind of nuance.
How Relative Sizing Creates Clarity
Instead of arguing about hours, story points spark a conversation about relative size. Think of it like packing boxes for a move. You don't need to know that one box will take exactly 12 minutes to pack and another will take 28. You just need to agree that the big box for the kitchen pots is much larger than the small box for the books.
Story points are an abstract measure of effort that allows team members with different skill levels to communicate about and agree on an estimate. It’s about agreeing on the size of the mountain, not how long it will take each person to climb it.
This approach gets the entire team aligned with a shared understanding of the work. The senior and junior developers can both agree a task is a "5-point" story, even if their individual time to completion differs. They're agreeing on its size, effort, and complexity relative to other tasks.
To get a better handle on the basics, you can explore our guide on what story points are in Scrum. This shift—away from individual time commitments and toward a collective agreement on effort—is what makes story points such a sustainable and accurate tool for agile teams.
Story Points vs. Hour-Based Estimates
Here’s a quick breakdown of how these two approaches stack up. The table below really highlights the fundamental differences in philosophy and practice.
| Attribute | Story Points | Hour-Based Estimates |
|---|---|---|
| Focus | Relative size (effort, complexity, uncertainty) | Absolute time (hours, days) |
| Nature | Abstract and unitless | Concrete and time-bound |
| Perspective | Team-based, consensus-driven | Individual-based, often siloed |
| Effect of Skill | Acknowledges skill differences; one size fits all | Creates conflict between senior/junior estimates |
| Adaptability | Easily accommodates unforeseen issues | Brittle; breaks when unexpected work appears |
| Goal | Fosters conversation and shared understanding | Seeks a precise, often inaccurate, time commitment |
| Forecasting | Used to calculate team velocity for long-term planning | Leads to missed deadlines and estimation "padding" |
Ultimately, story points steer the team toward a more collaborative and realistic planning process. By focusing on "how big" rather than "how long," teams build a more reliable and less stressful path to delivering value.
Choosing Your Estimation Scale: Fibonacci and T-Shirt Sizes
Alright, so you've made the mental shift from "how long will this take?" to "how big is this?" That's a huge step. Now, you need a common language for your team to talk about that size.
While you could invent your own scale, two methods have really stood the test of time: the modified Fibonacci sequence and T-shirt sizes. The one you pick becomes the shared vocabulary that keeps your team's estimates consistent. The whole point is to choose a framework that sparks the right conversations—ones focused on relative effort, not trying to nail down perfect, hour-by-hour predictions.
Why the Fibonacci Sequence Works So Well
The most common scale you'll see in the wild is a modified Fibonacci sequence: 0, 1, 2, 3, 5, 8, 13, 20, 40, 100. Those numbers aren't random; their non-linear progression is the secret sauce. The gaps between them get wider as the numbers get bigger, and that’s entirely on purpose.
This forces a decision. Is this story a 5 or an 8? You can't hedge your bets with a 6 or 7. This isn't a bug; it's a feature. It’s a built-in acknowledgment of the "cone of uncertainty"—the bigger and more complex a task is, the less we really know about it. An 8-point story isn't just a little bigger than a 5; it's a whole different level of effort and risk.
If you want to go deeper on this, our guide on Fibonacci Planning Poker really breaks down the nuts and bolts of how it plays out in a real session. A 13-point story isn't just a number; it's a flag telling everyone, "Hey, this is a big one, and we should probably break it down."
The Fibonacci scale acts as a built-in uncertainty buffer. A task estimated at 13 points isn’t just a little more complex than an 8—it’s a signal that the team has less clarity and there's a higher chance of encountering unforeseen obstacles.
When to Use T-Shirt Sizes
Sometimes, you're not ready for the nitty-gritty of Fibonacci numbers. For those early-stage backlog grooming sessions, T-shirt sizing (XS, S, M, L, XL) is fantastic. The goal is just to get a rough lay of the land without getting lost in the weeds.
Think of it like a first pass. The Product Owner can hold up a new feature idea and ask, "Team, is this a Small, Medium, or Large?" This quick categorization helps you sort through a huge backlog in no time and, most importantly, identify the XL monsters that absolutely must be sliced into smaller, more digestible stories.
Many teams even map T-shirt sizes back to their Fibonacci scale when it's time for sprint planning:
- XS (Extra Small): Pretty much a 1 or 2-point story.
- S (Small): Feels like a 3.
- M (Medium): This is your classic 5 or 8.
- L (Large): Now we're talking a 13 or 20.
- XL (Extra Large): Anything bigger. This is code for "break me down!"
This two-tiered approach is incredibly practical. You use T-shirts for a quick, high-level sort during backlog refinement, then switch to Fibonacci for the detailed, commitment-focused estimates during sprint planning.
The Power of a Reference Story
Here’s the thing: no matter which scale you pick, the numbers or sizes are completely meaningless without a baseline. This is where your reference story becomes the most important tool in your estimation toolkit.
A reference story is a simple user story the team has already completed. Everyone agrees, "Yep, that was a 3-point story," or "That was a solid Medium." It becomes your yardstick for everything else.
From that point on, every new story is compared against it. The conversation changes to:
- "Is this new ticket bigger or smaller than our reference 3-pointer?"
- "Does this feel like more effort than that 5-point story we did last sprint?"
This simple anchor is what stops "points inflation" and keeps everyone's estimates grounded in a shared reality. Without it, a "5" this sprint can mean something totally different from a "5" next month. Your reference story is your North Star for accurate, consistent estimation.
Running a Planning Poker Session That Actually Works
Once your team has a shared understanding of estimation scales, it’s time to put them into action. This is where Planning Poker comes in. It’s not just another meeting; it's a structured conversation designed to get everyone on the same page. A well-run session transforms estimation from a solo guessing game into a powerful, collaborative exercise that uncovers risks and assumptions early on.
The core idea is both simple and incredibly effective: prevent "anchoring bias." This is the common trap where the first number spoken aloud influences everyone else's vote. By having everyone reveal their estimate at the same time, you get a pure, unbiased read on how the team perceives the task's complexity. This is the moment where true alignment begins.
This diagram shows the basic flow for establishing a consistent estimation practice.
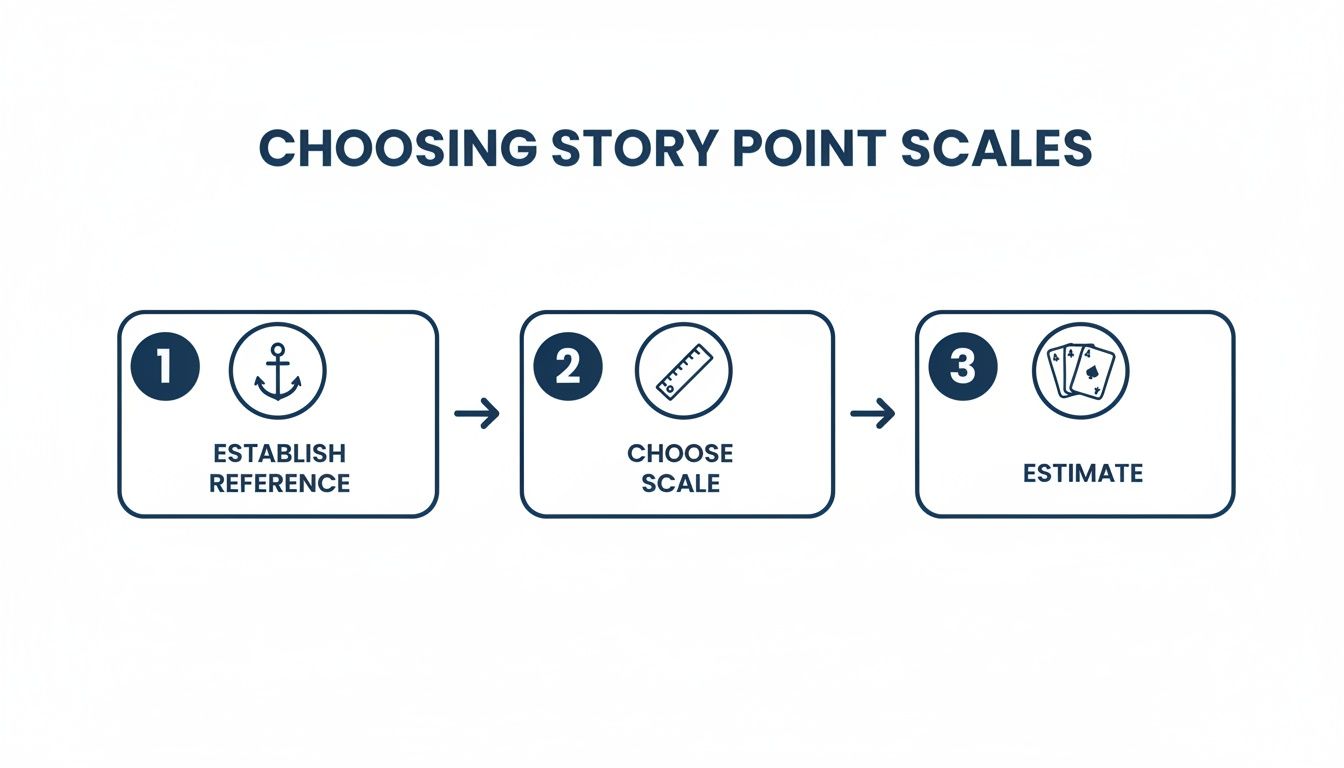
Starting with a reference story, choosing a scale, and then estimating forms a repeatable loop. Over time, this builds the team's confidence and makes your forecasts far more accurate.
Setting the Stage for Success
Before you even think about dealing the cards, a little prep work goes a long way. The Product Owner (PO) plays a crucial role here. Their job is to present each user story clearly, outlining the what and the why but leaving the how entirely to the development team.
The PO should walk through the story, hitting these key points:
- User Value: Who is this for, and what problem does it solve?
- Acceptance Criteria: How will we know when this is truly "done"?
- Q&A Time: This is the team's chance to ask clarifying questions before any numbers are thrown around.
This quick discussion ensures everyone is starting from the same place. A poorly understood story will always lead to wildly different estimates and wasted time. The goal is clarity, not just speed.
The Estimation Round in Action
With the story understood, the actual estimation can begin. Each team member—developers, QA, and anyone else doing the work—privately selects a card from their deck that represents their estimate. This private selection is the magic ingredient.
Once everyone has their card ready, the Scrum Master or facilitator does a countdown, and everyone reveals their card at the same time. This is where the real value of Planning Poker shines through. You'll instantly see where the team is aligned and, more importantly, where they aren't.
The simultaneous reveal is the heart of Planning Poker. It ensures the junior developer’s opinion is heard just as clearly as the senior architect’s, preventing groupthink and leading to a more honest estimate.
Navigating the Discussion on Outliers
So, what do you do when the cards show a mix of 3s, 5s, and a single 13? Celebrate! This isn't a failure; it’s an opportunity. The facilitator's next move is crucial: invite the folks with the highest and lowest estimates to explain their reasoning.
This isn't a debate to be won. It's a discussion to uncover hidden information.
- The person who voted 13 might say, "I'm thinking about the dependency on that new external API we haven't touched before. That adds a lot of uncertainty for me."
- The developer who voted 3 might counter, "Ah, but I worked on a similar feature last quarter. We can reuse most of that code, which makes this much simpler."
Suddenly, the whole team has new information. The high estimator revealed a risk others missed, while the low estimator pointed out a shortcut. This conversation is infinitely more valuable than the final number itself.
After this brief discussion, the team re-votes. You’ll usually find the estimates converge much more closely after just one or two rounds. For teams new to this, a tool like Scrum Planning Poker can help facilitate these rounds smoothly, especially for remote setups.
The goal isn't to force consensus or average the numbers. It's to reach a shared understanding. If the numbers are still miles apart after a couple of rounds, it's a huge red flag. It usually means the story is too big or too vague and needs to be refined by the Product Owner. Knowing when to pause and refine is just as important as reaching an agreement.
Using Team Velocity to Forecast with Confidence
Getting good at estimating story points is a skill your team builds over time, sprint by sprint. But the real magic happens when you start using those points to stop guessing and start forecasting. This is where team velocity comes in, turning those abstract numbers into a powerful tool for predicting what you can actually deliver.
Simply put, velocity is the average number of story points your team gets to "done" in a sprint. It’s not a target to chase; it's a reflection of your team’s proven capacity based on past performance.
Calculating Your Team Velocity
Figuring out your velocity is pretty straightforward, but you need a bit of data to make it reliable. A single sprint can be an anomaly—maybe you ran into unexpected blockers, or maybe everything just clicked perfectly. Relying on one sprint gives you a snapshot, not the full picture.
To get a stable, trustworthy number, you should calculate a running average of your last three to five sprints. This simple act smooths out the inevitable ups and downs, giving you a much more realistic metric to plan with.
Let's Run the Numbers
Imagine your team’s completed story points for the last three sprints look like this:
- Sprint 1: 25 points
- Sprint 2: 35 points (A really productive one!)
- Sprint 3: 28 points
To find the average, just add them up (25 + 35 + 28 = 88) and divide by the number of sprints (88 / 3). This gives you an average velocity of roughly 29 points per sprint.
This number is now your secret weapon for planning upcoming sprints and answering those bigger-picture questions about project timelines. It’s a data-driven look at what your team can realistically accomplish.
From Velocity to Forecasting
Once you have a stable velocity, you can finally give a confident answer to that classic stakeholder question: "So, when will it be done?"
Let's say your product backlog has a massive new feature that the team has broken down and estimated to be 120 story points in total.
With your velocity of 29 points, the math is simple:
120 total points / 29 points per sprint = ~4.13 sprints
This immediately tells you that the feature will likely take a little more than four sprints to complete. You can now go back to stakeholders and say something like, "Based on our established pace, we're forecasting this will take between four and five sprints to deliver." That’s a world away from a wild guess.
Crucial Takeaway: Velocity is a forecasting tool, not a performance metric. If you start using it to compare teams, measure individual productivity, or pressure the team for "more points," you'll destroy its value. Teams will just inflate their estimates, making your data completely useless for planning.
Why Velocity Is a Team-Specific Metric
It’s absolutely vital to remember that velocity is unique to each team. Team A’s 30 points isn’t better or worse than Team B’s 50 points. Because their reference stories and estimation scales are different, trying to compare them is like comparing apples and oranges—it's completely meaningless.
Several factors will always influence a team's velocity:
- Team Composition: The mix of senior and junior developers.
- Technical Debt: How much time is spent on refactoring or fixing old bugs.
- Domain Knowledge: The team's familiarity with the part of the product they're working on.
- External Dependencies: Time spent waiting on other teams or third-party services.
If your team’s makeup changes—a new person joins or a key developer leaves—the velocity will naturally change too. When that happens, you’ll need to give it a few sprints to let a new, stable velocity emerge before you can trust it for forecasting again. For a deeper dive, our article explaining what velocity is in Scrum provides even more context.
Ultimately, by properly using velocity, you give your team a powerful tool for self-management and give stakeholders the predictability they’ve always wanted.
Common Pitfalls and How to Avoid Them
Even the most well-oiled teams can fall into bad habits that drain the value right out of story points. These anti-patterns usually start with good intentions but can quickly turn a helpful, collaborative tool into a source of real friction.
Learning to spot these traps is the first step toward keeping your agile process healthy and your forecasts trustworthy. Remember, the goal isn't just to assign numbers to tasks; it's to spark conversations and get better at predicting what you can accomplish together.
Translating Points Directly to Hours
This is, without a doubt, the most common and damaging mistake. It happens the moment a manager sees an 8-point story and asks, "Okay, so how many days is that?" This pressure forces the team into a false conversion (like 1 point = 4 hours), which completely unravels the purpose of relative sizing.
Once you tie points back to time, you're right back in the world of problems you were trying to leave behind:
- It creates individual pressure. You can't pretend a senior developer's "4 hours" is the same as a junior's.
- It gives a false sense of precision. You end up with brittle deadlines that ignore the very real unknowns in complex work.
- It encourages estimate padding. Teams start inflating points to create a time buffer, which makes the data useless.
The fix? Gently but firmly coach stakeholders that points measure complexity and effort, not hours on a clock. Explain that velocity is the only real bridge between points and a timeline, and it works for the whole team over time, not for a single task.
Using Velocity as a Performance Weapon
Velocity is a fantastic forecasting tool for the team itself. But it becomes toxic the minute it's used by leadership to compare teams or demand "more points." When someone asks why Team A’s velocity is 30 while Team B’s is 50, it drives all the wrong behaviors.
This approach inevitably leads to teams inflating their story point estimates just to make their velocity look better. The metric becomes a vanity number, totally disconnected from reality and useless for forecasting.
Velocity is a team’s speedometer, not its engine. It tells you how fast you're going based on current conditions; trying to redline it will only cause a breakdown.
Instead of comparing raw velocity numbers, focus on stability. A team whose velocity is becoming more consistent and predictable—no matter the number—is a sign of a healthy, maturing process.
Letting a Single Voice Dominate
You’ve probably seen it happen during Planning Poker. The junior developers glance over at the tech lead, waiting to see what card they throw before choosing their own. This is a classic case of "anchoring bias," and it completely kills the collaborative spirit of the exercise.
The whole point of everyone revealing their cards at once is to get an honest, unfiltered perspective from each person. If one person’s opinion consistently sets the tone, you’re not getting a true team estimate—you're just getting one person's estimate with extra steps.
In the fast-paced world of distributed software development, organizations that adopt standardized story point estimation methodologies see dramatic improvements in project delivery. According to Gartner's Software Development Productivity Analysis, teams using these structured approaches are 2.8x more likely to meet project deadlines compared to those relying on ad-hoc methods. You can learn more about these structured story point estimation methodologies.
To fix this, the Scrum Master has to be the stickler for the rules. Insist on "cards up at the same time," no exceptions. If you notice anchoring is still a problem, try a new tactic: after the cards are revealed, ask one of the quieter team members to explain their reasoning first. Giving their perspective the floor can change the entire dynamic of the conversation.
Answering the Tough Questions About Story Points
Even with the best process in place, some tricky situations always seem to pop up when teams are getting the hang of story points. These are the real-world curveballs you'll see in sprint planning and retrospectives. Having solid, consistent answers ready is the key to keeping your estimations on track and everyone on the same page.
Let's dive into some of the most common questions I hear from teams.
How Do We Handle Points for Non-Coding Tasks?
This one comes up all the time. What about a research spike, a new CI/CD pipeline setup, or a deep-dive bug investigation? These tasks don't deliver a shiny new feature, but they absolutely chew up team capacity. The answer is straightforward: if it takes significant team effort, it gets story points.
The whole point of estimation is to make all work visible. If a research spike is a 5-point effort, that’s five points of your team's capacity that can't go toward building features. Ignoring these tasks creates a blind spot in your planning, making overcommitment almost inevitable.
- Research Spikes: You're estimating the effort to do the research and come back with a clear answer—not the potential work that might come after. It's also a good practice to time-box these to keep them from spiraling.
- Bug Fixes: For tiny bugs, most teams just fix them as they go without points. But for those nasty, complex bugs that demand real investigation and a tricky fix? You absolutely should estimate them. A gnarly bug can easily be an 8-point monster.
What If a Story Is Just Too Big to Estimate?
Picture this: during Planning Poker, the cards go up, and you see a wild spread of 20, 40, and 100. That’s not just a disagreement—it's a giant red flag. Your team is telling you this isn't a story; it's an epic. You simply can't put an accurate number on something that massive and full of unknowns.
As a rule of thumb, any story bigger than a certain number (many teams cap this at 13 or 20) shouldn't even be considered for a sprint. It’s a clear signal that the work isn't well understood or is far too large to tackle in one iteration.
A story that’s too big to estimate isn’t a problem; it’s a conversation waiting to happen. This is the Product Owner's cue to break the work down into smaller, independent user stories that the team can actually understand, estimate, and deliver.
The solution isn't to just shrug and pick the biggest number. The team needs to pause, send the story back for more refinement, and work with the product owner to slice it into smaller, more valuable pieces.
What Happens to Unfinished Work at the End of a Sprint?
It happens to everyone. The sprint ends, and that 8-point story is only halfway done. Do you get partial credit? The answer here is a hard no. In Scrum, we only count what is 100% "done." A story that's 99% finished offers zero value to the business until it crosses that finish line.
So, what do you do with that half-baked story?
- First, it goes right back into the product backlog. From there, the product owner decides if it’s still a top priority for the next sprint.
- Next, you re-estimate it. You only estimate the work remaining. That original 8-point story might only have 3 points of effort left to get it to "done."
This practice keeps your velocity honest by reflecting the actual value delivered, not just the effort you put in. It’s a crucial discipline that prevents your velocity from getting inflated with points for work that isn't actually shippable.
How Do Team Changes Mess with Our Velocity?
Your team's velocity is a unique fingerprint of its capacity. So, when the team changes—someone leaves, a new person joins, or a key member is on vacation—your historical velocity is no longer a reliable guide.
You can't just add or subtract a few points to "adjust" for the change. A new senior developer doesn't automatically add X points of capacity from day one. Team dynamics, communication overhead, and the learning curve all have a major impact.
When the team makeup changes, you have to accept that your forecasting will be a bit fuzzy for a little while. Give it about two to three sprints, and a new, stable velocity will naturally emerge. That becomes your new baseline for planning.
Ready to run faster, more effective estimation sessions? Scrum Planning Poker offers a free, no-signup tool designed to help your team run focused Planning Poker meetings, whether you're in the same room or spread across the globe. You can start your first session in seconds.