A Guide to Story Point Estimation in Agile Teams
If you've ever been asked, "How many hours will this take?" and felt a knot in your stomach, you know the pressure of time-based estimates. They’re often inaccurate, create unnecessary stress, and miss the point entirely. Story point estimation offers a much better way forward by changing the question.
Instead of trying to predict the future down to the minute, story point estimation helps teams assign a relative value to a piece of work. The conversation shifts from "How long will this take?" to "How big is this compared to other things we’ve done?" It’s a subtle but powerful change that transforms how teams plan and deliver.

The Core Idea: Relative Sizing
Let's use an analogy. Imagine you're moving houses and have a bunch of items to pack: a small book, a heavy lamp, a bulky microwave, and an awkwardly shaped vase. Guessing the exact minutes to pack each one is a fool's errand. You might get interrupted, struggle to find the right box, or just get tired.
But what if you just compare them? You intuitively know the lamp is about twice as much "work" to pack as the book. The microwave is way bigger than the lamp. That fragile vase? It's not heavy, but it's tricky, making the effort to pack it similar to the microwave. That's relative sizing in a nutshell. You’re not estimating time; you're comparing the overall effort.
In the world of agile development, this "bigness" is a blend of three key things:
- Effort: How much pure work is there to do?
- Complexity: How difficult is this work to figure out and build?
- Uncertainty: How many unknowns or risks are we dealing with here?
A story point rolls all three of these factors into a single number. It becomes a custom unit of measure that's meaningful only to the team using it.
Why It Works So Well
This approach brilliantly separates the estimate from individual skill levels. A senior developer might finish a task in two hours, while a junior developer needs eight. An hour-based estimate becomes a mess, but both developers can usually agree on the task's relative size and complexity compared to other work.
A story point is a relative unit of measure, decided upon and used by individual Scrum teams, to provide relative estimates of effort for completing requirements.
At the end of the day, story point estimation isn't about perfectly predicting a single task. It's about finding a consistent, sustainable pace. By sizing work relative to what they've already accomplished, teams start to understand their own capacity. This leads to much more reliable forecasts for what they can get done in a sprint, creating healthier release plans and a far more collaborative team dynamic.
Why Agile Teams Prefer Story Points Over Hours
If you're new to agile, you might start out estimating work in hours. It feels familiar, tangible, and safe. But most teams quickly run into the same old problems: time-based estimates are often wildly inaccurate, create a ton of pressure, and just don't jive with the way modern software gets built.
This is exactly why so many experienced teams make the switch to story point estimation. It’s more than just a different unit of measure; it’s a completely different way of talking about work.
The real magic of story points is that they capture the whole picture. Think of a story point as a single number that wraps up three critical factors:
- Effort: How much work is there to do? Is this a small tweak or a major overhaul?
- Complexity: How hard is this to figure out? Are we dealing with brand new logic or something we've done a million times?
- Uncertainty: What don't we know? Are there dependencies on another team? Is the technology unfamiliar?
By rolling these three things into one relative value, the team can agree on the "size" of a task without getting stuck on who is going to do it. A senior developer might knock out a task in four hours, while a junior dev needs twelve. But both can look at it and agree it’s a "5" compared to a much simpler "2-point" task. This creates a shared language and takes the individual pressure off.
It’s About Teamwork, Not Time clocks
When a developer says something will take "16 hours," it feels like a promise. If it takes longer, it can feel like a personal failure, which often leads to people padding their estimates just to be safe. That's not a great foundation for accurate planning.
Story points shift the ownership from the individual to the entire team. The estimate is a collective agreement, not one person's commitment. This simple change encourages honest, open debate during planning. A 2021 survey from Agile Alliance found that 65% of teams using story points saw a significant drop in arguments during estimation meetings. You can see a deeper dive into how story points stack up against other methods in our comprehensive guide on estimation techniques.
Story point estimation moves the conversation away from an individual’s time commitment and toward the team's collective assessment of a task's size. This creates a much safer space where the goal is shared understanding, not perfect time prediction.
Factoring in All the "Other Stuff"
One of the biggest traps of estimating in hours is that it ignores all the crucial work that isn't just heads-down coding. A developer's day is rarely just about writing code from start to finish.
Story points, on the other hand, naturally account for this overhead. Because points are based on what a team has actually accomplished in the past, they automatically factor in the time spent on:
- Daily stand-ups, retrospectives, and sprint planning
- Code reviews and giving feedback to teammates
- Putting out unexpected fires or fixing bugs
- Spiking a new feature or researching a solution
- Syncing up with designers, QAs, and product owners
This holistic view helps a team find a sustainable, predictable pace. By tracking the number of points they complete sprint after sprint, they figure out their velocity. Velocity isn't about speed; it's about capacity. Once a team's velocity stabilizes, they can forecast long-term work with surprising accuracy. This builds incredible trust with stakeholders because the release plans are based on real data, not guesswork.
That same Agile Alliance survey backed this up, with 78% of teams reporting that their sprint planning got much better after they started using story points. If you want to dig into the numbers, you can learn more about these story point findings in the full report.
Practical Story Point Estimation Techniques
Understanding the theory behind story points is one thing, but actually putting it to work effectively is where the real magic happens. To get estimates you can trust, your team needs a structured way to talk through the work, share insights, and surface any hidden assumptions.
Fortunately, you don't have to reinvent the wheel. Several tried-and-true techniques have become staples for agile teams because they just plain work. Let's walk through the most common methods, each offering its own blend of speed, accuracy, and collaboration.
Planning Poker: The Gold Standard
When people talk about story pointing, they’re usually thinking of Planning Poker. It’s the most popular technique for a reason: it’s a simple, gamified process that encourages deep discussion and drives the team toward a shared understanding of what it takes to get a story done.
The big win with Planning Poker is that it completely avoids anchoring—that all-too-common problem where the first number mentioned sways everyone else’s opinion. Instead, everyone reveals their estimate at the same time.
Here’s how it typically unfolds:
- Present the Story: The Product Owner walks the team through a user story, explaining the "why" and the "what." The team asks clarifying questions to make sure they're all on the same page.
- Vote Privately: Each person privately selects a card from a deck that reflects their estimate. Most teams use a modified Fibonacci sequence (0, 1, 2, 3, 5, 8, 13, 20...), because the growing gaps between numbers naturally represent the increased uncertainty that comes with bigger tasks.
- Reveal and Discuss: On the count of three, everyone shows their card. If the numbers are pretty close, great! The team can quickly lock in an estimate and move on.
- Explore the Outliers: The real value comes when the votes are far apart. If you see a 3 and a 13 for the same story, it’s a signal that people are interpreting the work very differently. The team members with the lowest and highest estimates share their thinking, which almost always uncovers something important—a missed technical dependency, a hidden complexity, or an overly simple assumption.
- Vote Again: After that crucial discussion, the team re-votes. You repeat this quick cycle until the estimates converge and everyone feels confident in the final number.
This process forces a shift in mindset, moving the team away from tracking hours and toward a more holistic view of effort.
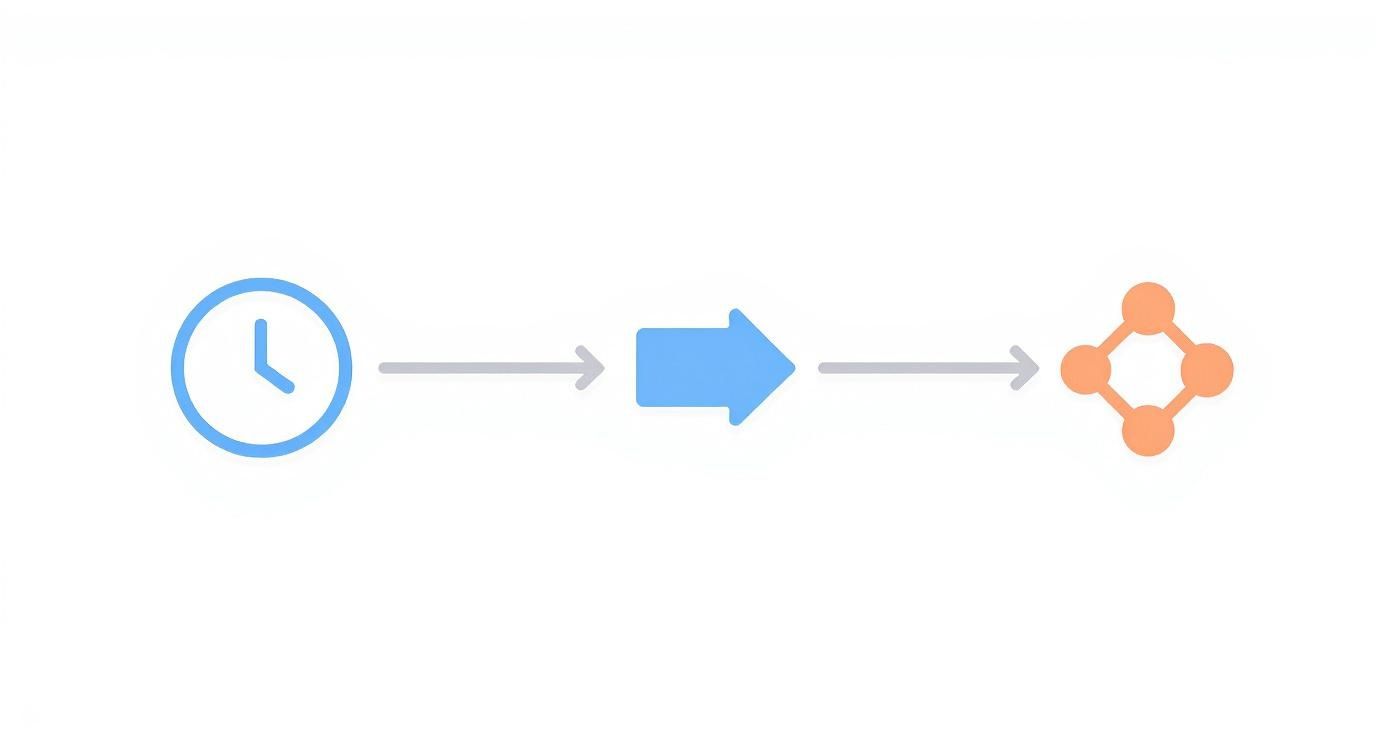
As you can see, it’s about embracing flexible, relative sizing instead of getting stuck on rigid time-based predictions. For a much deeper dive into the nuts and bolts, check out the complete guide to Planning Poker and how to estimate user stories.
T-Shirt Sizing: For a Quick Big-Picture View
Sometimes you just don't need the pinpoint precision of Planning Poker. When you're looking at a huge backlog or doing some early-stage roadmap planning, T-Shirt Sizing is your best friend. It’s fast, simple, and keeps the conversation high-level.
Instead of numbers, the team uses familiar sizes—Extra Small (XS), Small (S), Medium (M), Large (L), and Extra Large (XL). The goal is to quickly sort work into rough buckets of effort.
This is perfect for getting a ballpark idea of an epic’s scope without getting lost in the weeds too early. Later, as those stories get closer to being worked on, you can pull them into a Planning Poker session to give them a proper story point value.
Affinity Mapping: For Estimating in Bulk
What happens when you’re facing a mountain of user stories? A hundred or more items that all need a rough estimate? Trying to play Planning Poker for each one would take forever and drain all the energy from the room.
This is exactly where Affinity Mapping (sometimes called Affinity Grouping) comes in. It’s a super visual and collaborative way to get through a large volume of work in a fraction of the time.
The setup is easy:
- Write every user story on a sticky note and stick them all on a large whiteboard.
- Without talking, team members start moving the notes around, grouping them into columns with other stories that feel like a similar size.
- Once the movement slows down, the team talks through the groupings, makes a few final adjustments, and assigns a story point value to each column (e.g., this whole column is "3s," the next one is "8s," and so on).
The point here isn't to perfectly estimate every single story. It's about rapidly establishing their size relative to each other. It’s an incredibly powerful way to get a "good enough" estimate on a massive amount of work, fast.
Comparing Popular Estimation Techniques
So, which technique is the right one? It always comes down to what you’re trying to accomplish. Each method has its own strengths and is suited for a different situation.
This table breaks down the core differences to help you decide when to use each one.
| Technique | Best For | Key Advantage | Potential Drawback |
|---|---|---|---|
| Planning Poker | Detailed sprint planning for individual user stories. | Fosters deep discussion and uncovers hidden complexities. | Can be time-consuming for large backlogs. |
| T-Shirt Sizing | High-level backlog grooming and initial project scoping. | Extremely fast and keeps the focus on the big picture. | Too imprecise for accurate sprint commitment. |
| Affinity Mapping | Estimating a large number of stories at once. | Very efficient for batch estimation and highly collaborative. | Less detailed discussion per individual story. |
In the end, most experienced teams don't stick to just one method. They build a toolkit. They might use T-Shirt Sizing for quarterly planning, switch to Affinity Mapping to get the next few sprints groomed, and then use Planning Poker to get precise, commitment-ready estimates for the sprint they’re about to start.
How to Run Effective Estimation Sessions
A great story point estimation session is far more than just a meeting to throw numbers at a backlog. When it's done right, it's a structured conversation that builds a deep, shared understanding of the work ahead. It turns chaotic guesswork into a collaborative—and surprisingly accurate—planning tool.
The secret isn't just about the technique you use. It all comes down to the prep work and facilitation that guide the team toward a genuine consensus. It all starts with building a solid foundation.
Before you can estimate anything new, the team needs a common yardstick. This is where calibration comes in, and frankly, it's a step too many teams skip. The goal is to establish a set of reference stories—past work that the whole team knows inside and out. These become your unbreakable benchmarks.
Establish Your Baseline Stories
To get started, pull a few user stories your team has already finished. You'll want a good mix of sizes and complexities. The best reference stories are the ones everyone remembers vividly, from the easy wins to the ones that gave you a few headaches.
For instance, your baseline might look something like this:
- 1 Point: A simple text change on the homepage. Everyone agrees it was totally straightforward, with no surprises.
- 3 Points: Adding a new, standard field to a form. This included the database change and some basic validation work.
- 8 Points: Implementing a new third-party API. It took a bit of research and had a few tricky edge cases to sort out.
Once you agree on these, write them down somewhere everyone can see them. During estimation, you'll constantly point back to them. The question is no longer an abstract, "How big is this?" It becomes a much more tangible, "Is this new story bigger or smaller than our 3-point reference story?"
A well-calibrated team doesn't estimate in a vacuum. They constantly compare new work to a shared library of completed work, which anchors their estimates in reality and keeps them consistent over time.
This simple practice single-handedly prevents "estimation drift," that slow, creeping change where a "5-point story" means something different today than it did three sprints ago.
Tips for Effective Facilitation
The facilitator—usually the Scrum Master—is the key to a productive session. Their job isn't to have an opinion on the estimate but to guide the conversation, ensuring every voice is heard and the team lands on a consensus they can stand behind. A great facilitator is part moderator, part coach, and part protector of the process.
Here are a few practical tips for anyone leading an estimation session:
- Ensure Stories are Ready: Never estimate a story that's half-baked. The Product Owner should be ready to walk through the requirements and acceptance criteria, and the team must have a chance to ask clarifying questions before any numbers come out.
- Guard Against Anchoring: Anchoring bias is a powerful psychological trap where the first number mentioned taints everyone else's judgment. This is why techniques like Planning Poker, where everyone reveals their estimate at once, work so well. If you’re just having an open discussion, remind the team to think for themselves before anyone speaks up. If you're new to the concept, getting started with Planning Poker offers a great framework for sidestepping this pitfall.
- Encourage Outlier Explanations: When you see a "3" and a "13" for the same story, don't just average them out and move on. This is a golden opportunity. Ask the highest and lowest estimators to explain their thinking. This conversation almost always uncovers hidden complexity, a missed detail, or a bad assumption. The discussion is often more valuable than the final number.
- Keep the Focus on Relative Sizing: It's so easy for the conversation to drift back into hours or days. When it does, gently steer it back. Remind them to compare the story against your established baselines. A great prompt is, "Okay, I hear you. But is this work more or less complex than our 8-point API integration story?"
- Timebox Discussions: Good conversation is crucial, but getting stuck on one story for 30 minutes is a waste of everyone's time. If the team is just going in circles, it’s a huge red flag that the story isn't ready. The best move is to table it, ask the Product Owner to refine it, and bring it back next time.
Improving Accuracy with Data and Metrics
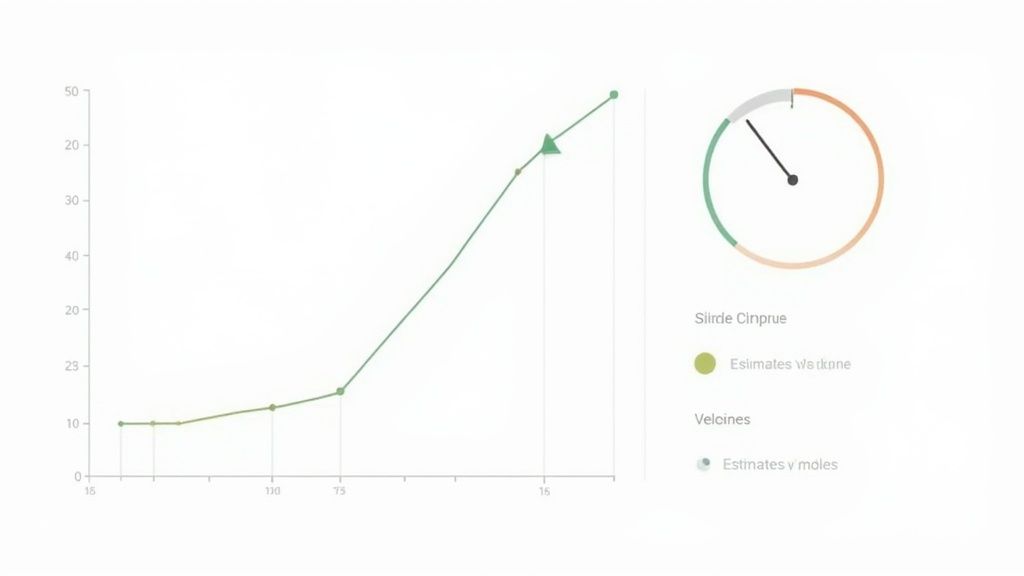
While all the collaboration and discussion in Planning Poker is great, that’s just the art of estimation. To really nail it, you have to bring in the science. This is where you stop making educated guesses and start using your team’s own historical data to create forecasts you can actually trust. It's what separates teams that are consistently predictable from those whose estimates feel like a shot in the dark.
The key is to look beyond just the current sprint and start spotting trends. By tracking what your team actually gets done, sprint after sprint, you build an invaluable feedback loop. This isn’t about judging anyone or cracking a whip; it’s simply about learning your team's natural, sustainable pace.
Calculating and Using Team Velocity
The most important metric you'll use is Team Velocity. It’s nothing more than the average number of story points your team gets to "Done" in a sprint. Think of it not as a target to beat, but as a realistic measure of your team's capacity.
Figuring it out is pretty simple:
- Count Your Points: When a sprint ends, add up the story points for every single user story that meets your team’s Definition of Done.
- Look Back a Bit: Do this for a few sprints in a row—3 to 5 is usually a good number. This helps smooth out any weird one-off sprints and gives you a much more stable baseline.
- Do the Math: Just divide the total points completed by the number of sprints. That’s your average velocity.
So, if your team knocked out 22, 26, and 24 points over the last three sprints, your average velocity is 24. This little number is gold. It tells you that committing to 40 points next sprint is probably a recipe for stress and disappointment.
But don’t stop there. An even better approach is to use a velocity range. Using that same data (22, 26, 24), you can confidently say your team will likely finish between 22 and 26 points. This gives stakeholders a much more honest forecast because it acknowledges that life—and software development—is rarely perfectly consistent.
Visualizing Progress and Identifying Drift
Numbers are great, but charts make the story easy to see. Visualizing your data helps everyone, from developers to stakeholders, understand what's happening at a glance.
Two of the most useful charts for this are burndown and burnup charts.
- Burndown Chart: This tracks the story points remaining in a sprint. Ideally, you want to see a nice, steady slope downwards to zero. If that line flatlines or starts creeping up, it’s a huge red flag that something is wrong—maybe the team is blocked or they’ve just taken on way too much.
- Burnup Chart: This shows two things: the total scope of work and how much you've completed over time. It’s fantastic for tracking progress toward a big release and instantly shows the impact of scope creep when new work gets added to the pile.
Tracking estimated points versus what you actually complete is how you catch "estimation drift." This is a sneaky problem where what the team calls a 5-point story today is way more work than a 5-point story was six months ago. Without data, this drift is almost invisible.
Ignoring these trends can have a major impact. A 2022 analysis found that teams who consistently tracked their estimation data saw a 29% reduction in estimation errors. On the flip side, teams that didn't were prone to that "estimation drift," with some seeing their estimates off by as much as 60% from the actual effort. You can discover more insights about these estimation findings to see just how critical this is.
When you let data be your guide, your team can constantly fine-tune its process. You end up with an estimation system that isn't just a collaborative exercise, but one that becomes more and more accurate over time.
Common Story Point Traps (and How to Sidestep Them)
Knowing what not to do with story points is just as important as knowing the right way to use them. Even teams with the best intentions can slip into bad habits that turn a helpful planning tool into a source of constant friction. Avoiding these common traps is key to keeping your estimation process honest, effective, and collaborative.
The #1 Mistake: Tying Story Points Directly to Hours
This is the big one. It’s so tempting to create a simple conversion, like “one point equals eight hours,” but doing so completely defeats the purpose of the system. The moment you tie points to time, you've lost the magic.
Story points are meant to be an abstract, relative measure. This is what allows a senior developer and a junior developer to look at the same task and agree on its size, even if it takes them different amounts of time to complete.
Once you say a point equals a set number of hours, you're not doing relative estimation anymore. You're just time-tracking with extra steps, bringing back all the old pressures and flawed assumptions story points were created to get rid of.
This practice forces everyone to mentally calculate the hours anyway and then work backward to a point value. The conversation shifts from "How big is this?" to "How long will this take me?"—and the collaborative value evaporates.
Using Velocity as a Performance Weapon
Another critical error is treating velocity as a way to measure individual productivity or compare teams. Velocity is a forecasting tool for one specific team, full stop. It helps you predict roughly how much work that team can pull into the next sprint.
A team with an average velocity of 20 isn't "worse" or "slower" than a team with a velocity of 40. It just means their internal sizing scales are different. That’s it.
When managers treat velocity as a target to be beaten each sprint, it creates a toxic environment. Teams will naturally start inflating their estimates or cutting corners on quality just to hit the number. The metric becomes meaningless for forecasting, which was its only job in the first place.
Other Traps to Watch For
A few other bad habits can quietly sabotage your estimation process. Be on the lookout for these:
- Managers Overruling Estimates: The estimate must come from the people who will actually do the work. When a manager or team lead pressures developers to accept a lower number, it’s no longer a real estimate—it's a deadline in disguise.
- Averaging Points to End a Debate: If you get a 3 and a 13 during Planning Poker, don't just meet in the middle at an 8 to move on. The most valuable part of the process is the discussion that follows. That gap in understanding is where hidden risks and assumptions are uncovered.
- Forgetting to Re-Calibrate: Teams change, skills improve, and your understanding of the product deepens. The "3-point story" from six months ago might feel like a 2-pointer today. Take time every so often to revisit your baseline stories and make sure they still make sense.
By steering clear of these mistakes, you protect the integrity of your estimation process. Keep your focus on relative sizing and use velocity for what it is—a simple forecasting tool, not a report card—and your team can build a workflow that’s both sustainable and predictable.
Common Questions About Story Points
Even when you've got the basics down, certain situations always seem to pop up and cause confusion. Let's tackle some of the most common questions teams have when they start putting story point estimation into practice.
How Should We Estimate Bugs and Spikes?
This one comes up all the time. The short answer? Yes, you absolutely should. A good rule of thumb is if it takes up your team's time, it gets an estimate.
Bugs aren't just minor fixes; they often involve digging into old code, figuring out what went wrong, and then implementing a solution. That's a perfect mix of effort, complexity, and uncertainty—exactly what story points are designed to capture.
The same goes for technical spikes. While a spike might not end with a new feature for the customer, it’s still valuable work that consumes team capacity. Estimating these tasks makes their cost visible and ensures your team's velocity is an honest reflection of everything you're working on.
What Should a Brand New Team Do?
Starting with a blank slate can feel daunting. With no historical data, how do you even begin?
The trick is to just start. Don't aim for perfection on day one. In your very first sprint planning meeting, find a user story that the whole team understands well. It should be small and straightforward. Collectively decide to call it a "2" or a "3"—this becomes your reference point, your "golden story."
Now, estimate everything else relative to that story. Is this new task a bit bigger? Maybe it's a 5. Is it much simpler? It’s probably a 1. Your velocity in that first sprint is just a number; it's not good or bad, it's just a starting point. After a couple of sprints, you'll have a much clearer picture of what your team can actually accomplish.
The initial goal isn't perfect accuracy. It's about building a shared understanding and a consistent relative scale. The worst thing you can do is get stuck in "analysis paralysis." Just start, and let the data guide you.
Can We Change an Estimate After the Sprint Starts?
It's tempting, but you should really try to avoid this. Think of the story point estimate as a snapshot of the team's collective knowledge before work began. It's a tool for planning, not a running score.
Once the sprint is underway, the team’s focus should be on getting the work done, not re-evaluating estimates.
What if a story turns out to be way more complex than you thought? That’s not a failure; it’s a fantastic learning opportunity for your next retrospective. It highlights a blind spot in your refinement process that you can now fix. Changing points mid-sprint muddies the waters and makes your velocity a less reliable metric for future planning.
Consistency is key. A 2023 study of distributed teams showed that standardizing estimation practices led to a 47% drop in estimation variance and a 42% increase in on-time delivery. Sticking to your original estimates helps build that consistency. You can dig into the numbers and read the full research on estimation methodologies to see just how much of an impact it can make.
Ready to make your estimation meetings faster and more collaborative? Scrum Planning Poker is a free tool—no signup required—that helps your team find consensus without the hassle. Get your first session started at https://onlineplanningpoker.com.